Inputs
Introduction
Inputs receive values that users can change from a script’s “Settings/Inputs” tab. By utilizing inputs, programmers can write scripts that users can more easily adapt to their preferences.
The following script plots a 20-bar simple moving average (SMA) using a call to the ta.sma() function.
While it is straightforward to write, the code is not very flexible
because the function call uses specific source and length arguments
that users cannot change without modifying the code:
If we write our script this way instead, it becomes much more flexible,
as users can select the source and the length values they want to
use from the “Settings/Inputs” tab without changing the source code:
Inputs are only accessible while a script runs on a chart. Users can access script inputs from the “Settings” dialog box. To open this dialog, users can:
- Double-click on the name of an on-chart indicator
- Right-click on the script’s name and choose the “Settings” item from the dropdown menu
- Choose the “Settings” item from the “More” menu icon (three dots) that appears when hovering over the indicator’s name on the chart
- Double-click on the indicator’s name from the Data Window (fourth icon down to the right of the chart)
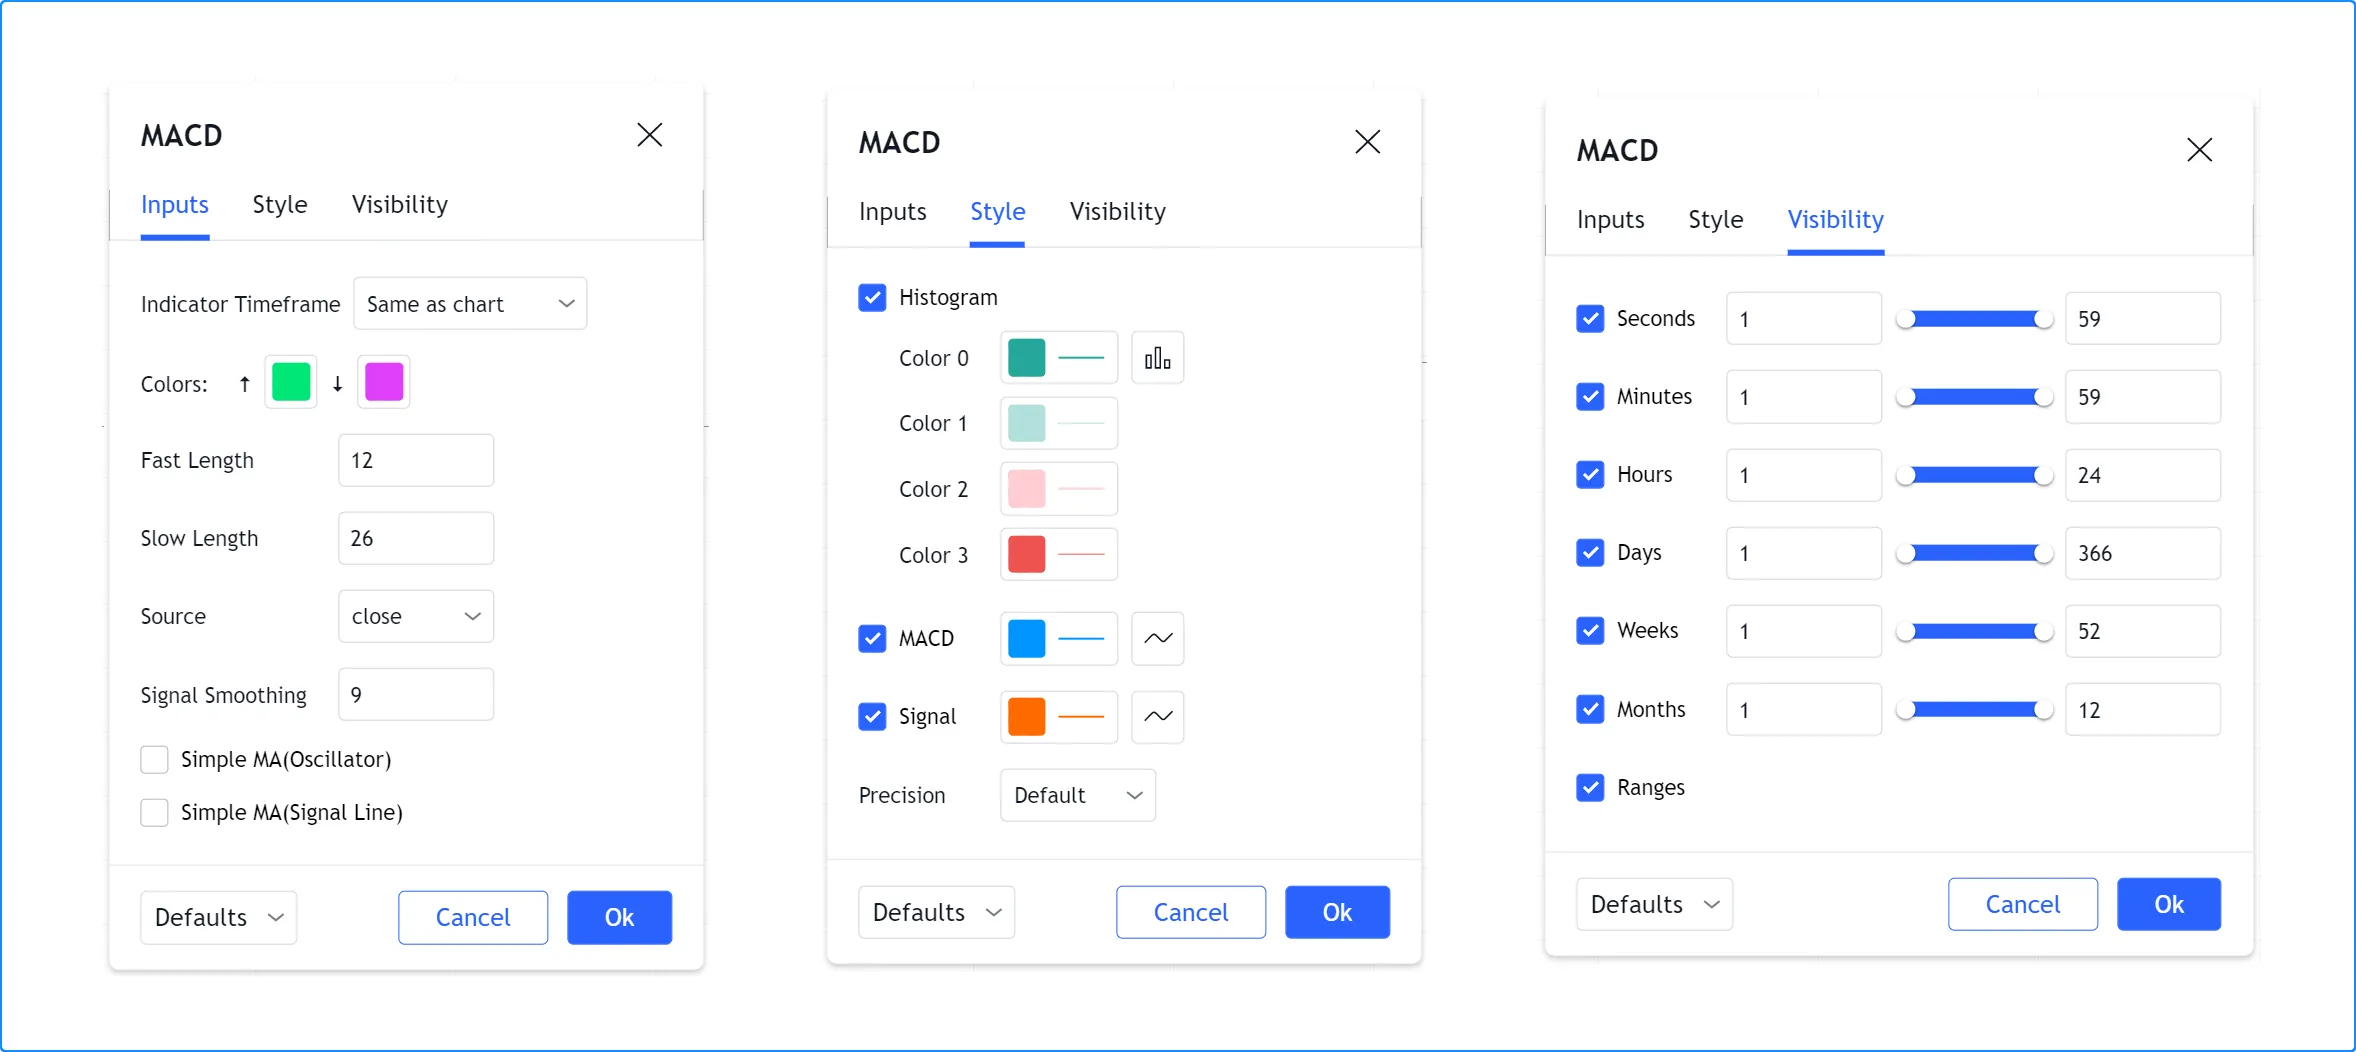
The “Settings” dialog always contains the “Style” and “Visibility” tabs, which allow users to specify their preferences about the script’s visuals and the chart timeframes that can display its outputs.
When a script contains calls to input.*() functions, an “Inputs” tab
also appears in the “Settings” dialog box.
Scripts process inputs when users add them to the chart or change the values in the script’s “Settings/Inputs” tab. Any changes to a script’s inputs prompt it to re-execute across all available data using the new specified values.
Input functions
Pine Script® features the following input functions:
- input()
- input.int()
- input.float()
- input.bool()
- input.color()
- input.string()
- input.text_area()
- input.timeframe()
- input.symbol()
- input.source()
- input.session()
- input.time()
- input.price()
- input.enum()
Scripts create input widgets in the “Inputs” tab that accept
different types of inputs based on their input.*() function calls. By
default, each input appears on a new line of the “Inputs” tab in the
order of the input.*() calls. Programmers can also organize inputs in
different ways by using the input.*() functions’ group and inline
parameters. See this section below for more information.
Our Style guide
recommends placing input.*() calls at the beginning of the script.
Input functions typically contain several parameters that allow programmers to define their default values, value limits, their organization in the “Inputs” tab, and other properties.
Since an input.*() call is simply another function call in Pine
Script, programmers can combine them with
arithmetic, comparison,
logical, and
ternary
operators to assign expressions to variables. This simple script
compares the result from a call to
input.string()
to the “On” string and assigns the result to the plotDisplayInput
variable. This variable is of the “input bool” type because the
==
operator returns a “bool” value:
All values returned by input.*() functions except “source” ones are
“input” qualified values. See our User Manual’s section on
type qualifiers for more information.
Input function parameters
The parameters common to all input functions are: defval, title,
tooltip, inline, group, display, and active. Some input functions also
include other parameters: options, minval, maxval, step and
confirm.
Most input parameters require “const” arguments. However, two parameters allow values with stronger qualifiers: the active parameter of all input*() functions accepts an “input bool” value, and the defval parameter of input.source() accepts a “series float” value.
The parameters that require “const” arguments cannot use dynamic values or results from other input*() calls as arguments, because “input” and other qualifiers are stronger than the “const” qualifier. See the Type system page for more information.
Let’s examine each parameter:
defval
input*() functions. The required type for a defval argument depends on the input function type, e.g., an “int” defval argument for input.int(), a “string” defval argument for input.string(), etc. The generic input function infers its input type based on the defval argument used in the input() call.
title
title string, the input variable’s name appears as the label.
tooltip
tooltip argument displays a question mark icon to the right of the input field, which shows the tooltip’s text when users hover over it. The tooltip string supports newline (\n) characters.
inline), the tooltip always appears to the right of the rightmost field and displays the text of the last tooltip argument specified in the line.
inline
inline argument in multiple input*() calls displays their input widgets on the same line in the “Inputs” tab. The tab’s width limits the amount of input widgets that can fit on one line; longer lines are automatically wrapped. The inline string is case-sensitive, so input*() calls must use the same characters and letter case in their inline arguments to appear in the same line.
inline argument, unique or otherwise, displays the input’s field immediately after its label, rather than keeping it left-aligned with other input fields as default. Unlike the group heading, the inline string does not appear in the “Inputs” tab.
group
group argument in any number of input*() calls groups the inputs in an organized section in the “Inputs” tab. The string used as the group argument becomes the section’s heading. The group string is case-sensitive, so input*() calls must use the same characters and letter case in their group arguments to appear in the same section.
display
display argument.
active
true by default. If false, the input field appears dimmed and users cannot change its value. This parameter accepts an “input bool” argument, so an input’s active state can depend on the value of other inputs.
showAverageInput toggle to show or hide an average line, we can use active = showAverageInput in other inputs related to the average, such as averageLengthInput or averageColorInput, to enable them only when users select the “Show average” checkbox.
options
["ON", "OFF"], [1, 2, 3], [myEnum.On, myEnum.Off]). These elements appear in a dropdown widget, from which users can select only one value at a time. If an input uses the options parameter, the defval value must be one of the list’s elements.
minval
maxval
step
step value is 1.
confirm
true, the input widget appears in a “Confirm inputs” dialog box when users add the script to the chart, prompting them to configure the input value before the script executes. By default, this parameter’s value is false. If more than one input.*() call uses confirm = true in the same script, multiple input widgets appear in the dialog box.
confirm = true for a time input or price input enables an interactive input mode where users can click on the chart to set time and price values.
The minval, maxval, and step parameters are only present in the second signatures of the input.int()
and input.float() functions. Their first signatures use the options parameter instead. Function calls that use a minval, maxval, or step argument cannot also use an options argument.
Input types
The next sections explain what each input function does. As we proceed, we will explore the different ways you can use input functions and organize their display.
Generic input
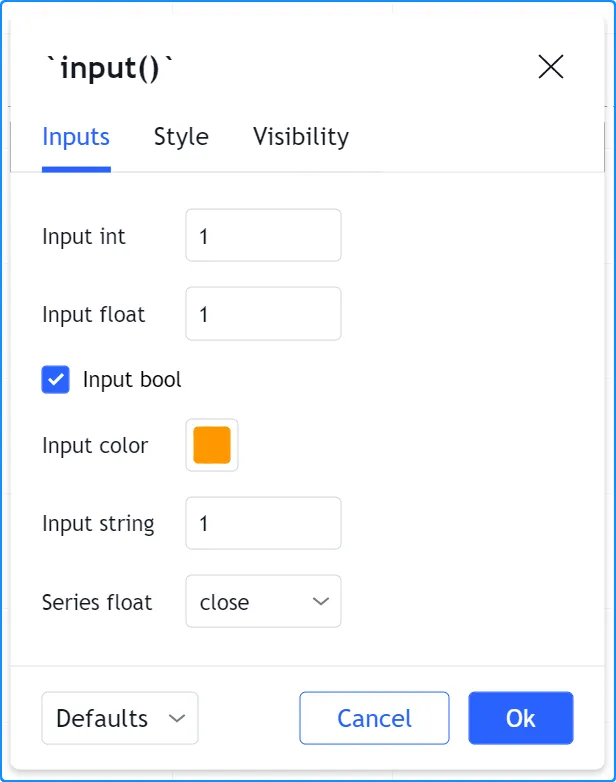
input() is a simple, generic function that supports the fundamental Pine Script types: “int”, “float”, “bool”, “color” and “string”. It also supports “source” inputs, which are price-related values such as close, hl2, hlc3, and hlcc4, or which can be used to receive the output value of another script.
Its signature is:
input(defval, title, tooltip, inline, group, display, active) → input int/float/bool/color/string | series floatThe function automatically detects the type of input by analyzing the
type of the defval argument used in the function call. This script
shows all the supported types and the qualified type returned by the
function when used with defval arguments of different types:
Integer input
Two signatures exist for the
input.int()
function; one when options is not used, the other when it is:
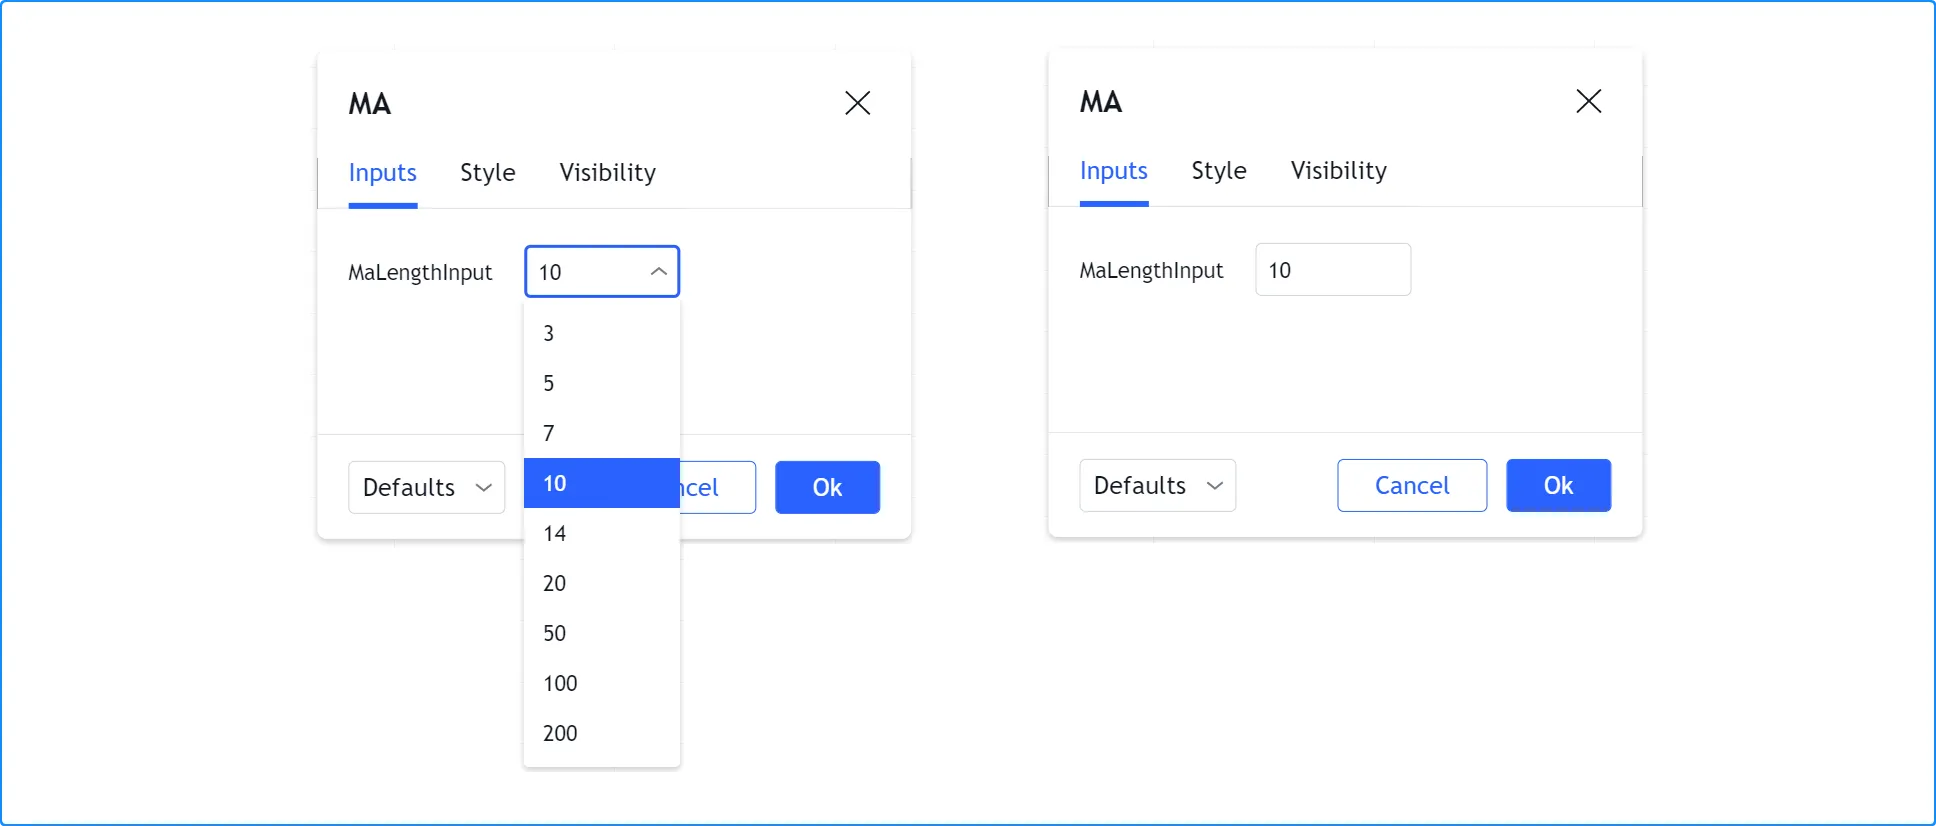
input.int(defval, title, minval, maxval, step, tooltip, inline, group, confirm, display, active) → input intinput.int(defval, title, options, tooltip, inline, group, confirm, display, active) → input intThis call uses the options parameter to propose a pre-defined list of
lengths for the MA:
This one uses the minval parameter to limit the length:
The version with the options list uses a dropdown menu for its widget.
When the options parameter is not used, a simple input widget is used
to enter the value:
Float input
Two signatures exist for the
input.float()
function; one when options is not used, the other when it is:
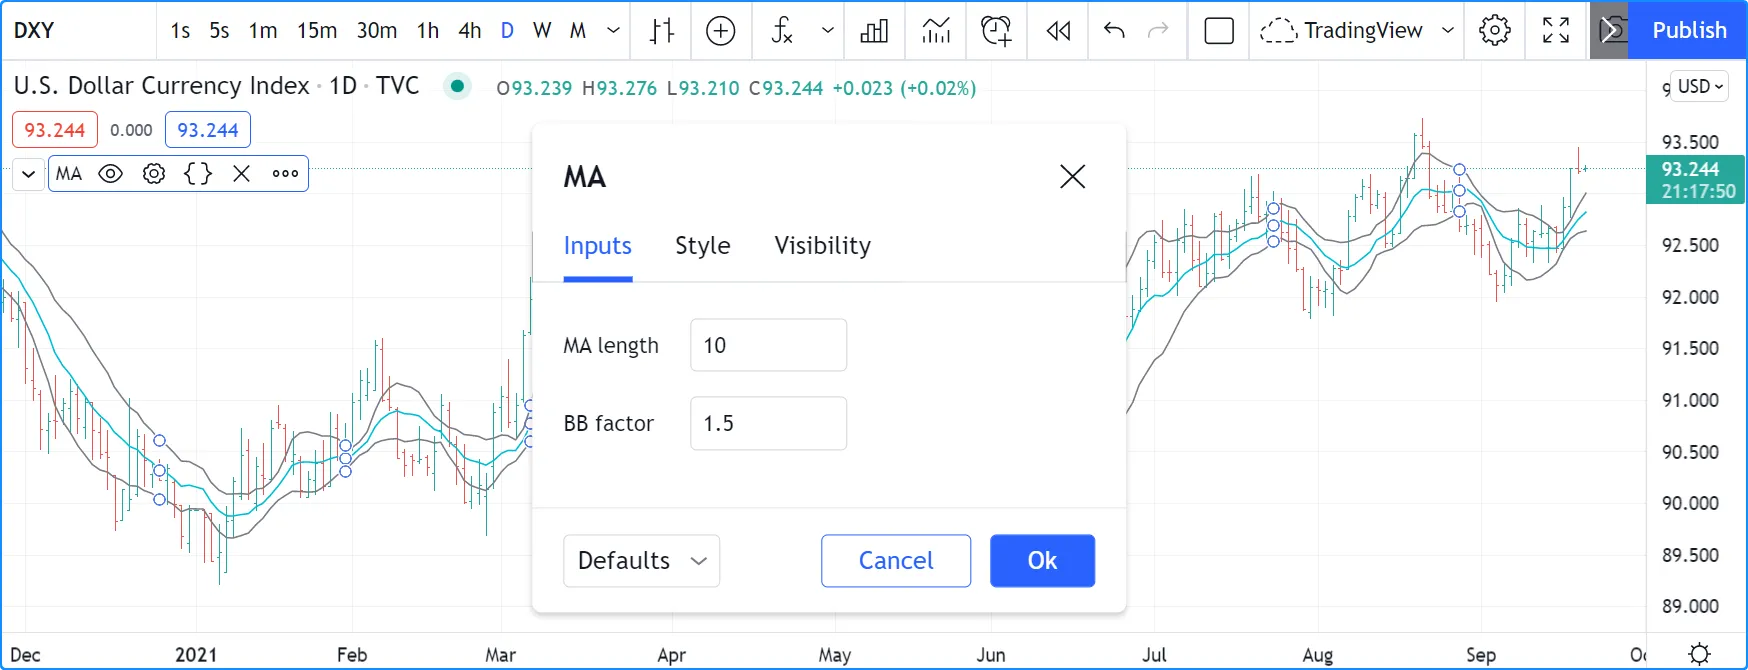
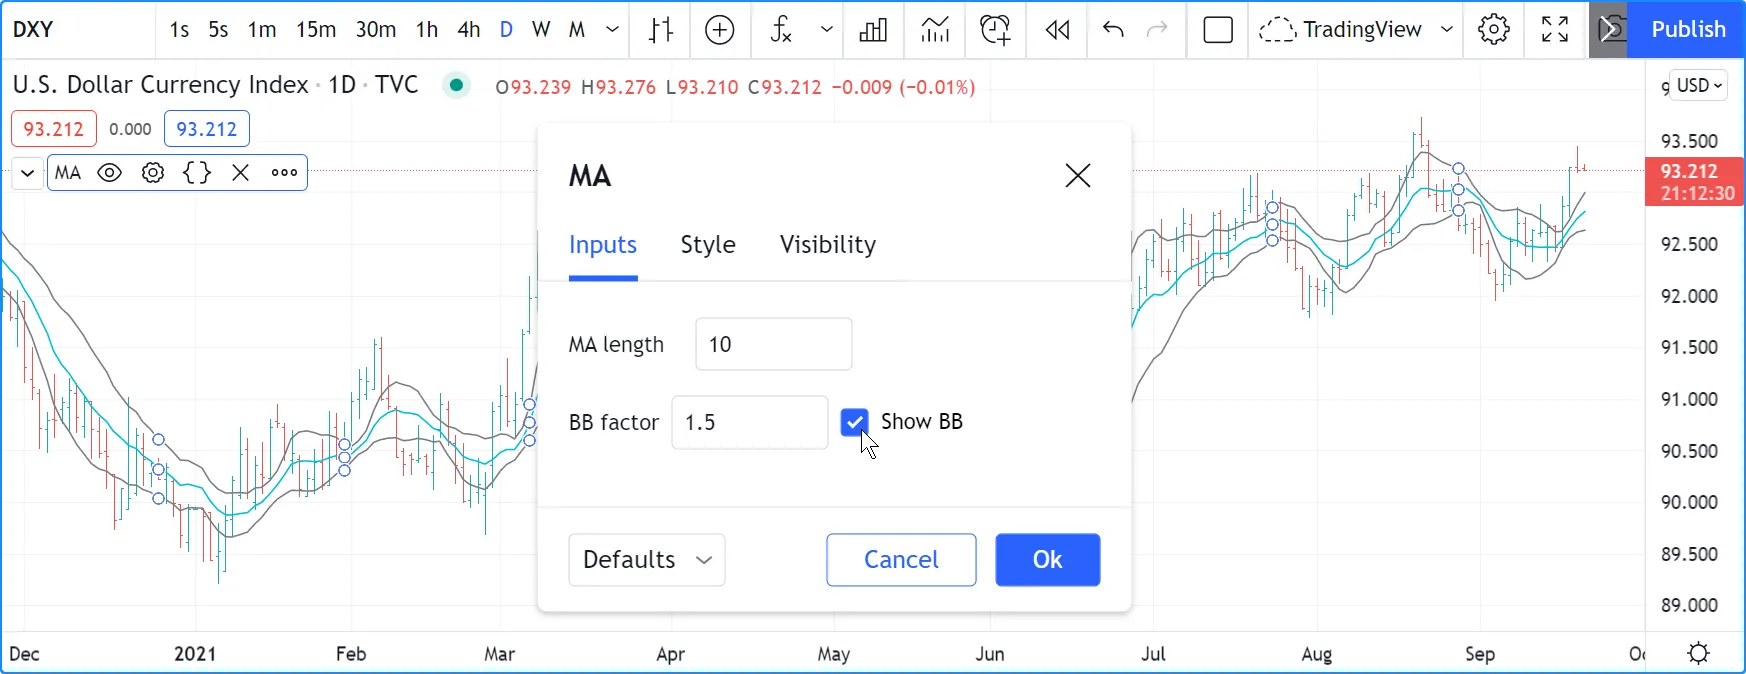
input.float(defval, title, minval, maxval, step, tooltip, inline, group, confirm, display, active) → input intinput.float(defval, title, options, tooltip, inline, group, confirm, display, active) → input intHere, we use a “float” input for the factor used to multiple the standard deviation, to calculate Bollinger Bands:
The input widgets for floats are similar to the ones used for integer inputs:
Boolean input
Let’s continue to develop our script further, this time by adding a boolean input to allow users to toggle the display of the BBs:
Note that:
- We have added an input using
input.bool()
to set the value of
showBBInput. - We use the
inlineparameter in that input and in the one forbbFactorInputto bring them on the same line. We use"01"for its argument in both cases. That is how the Pine Script compiler recognizes that they belong on the same line. The particular string used as an argument is unimportant and does not appear anywhere in the “Inputs” tab; it is only used to identify which inputs go on the same line. - We have vertically aligned the
titlearguments of ourinput.*()calls to make them easier to read. - We use the
showBBInputvariable in our two plot() calls to plot conditionally. When the user unchecks the checkbox of theshowBBInputinput, the variable’s value becomesfalse. When that happens, our plot() calls plot the na value, which displays nothing. We usetrueas the default value of the input, so the BBs plot by default. - Because we use the
inlineparameter for thebbFactorInputvariable, its input field in the “Inputs” tab does not align vertically with that ofmaLengthInput, which doesn’t useinline.
Color input
As explained in this section of the Colors page, selecting the colors of a script’s outputs via the “Settings/Style” tab is not always possible. In the case where one cannot choose colors from the “Style” tab, programmers can create color inputs with the input.color() function to allow color customization from the “Settings/Inputs” tab.
Suppose we wanted to plot our BBs with a lighter transparency when the high and low values are higher/lower than the BBs. We can use a code like this to create the colors:
When using dynamic (“series”) color components like the transp
arguments in the above code, the color widgets in the “Settings/Style”
tab will no longer appear. Let’s create our own input for color
selection, which will appear in the “Settings/Inputs” tab:
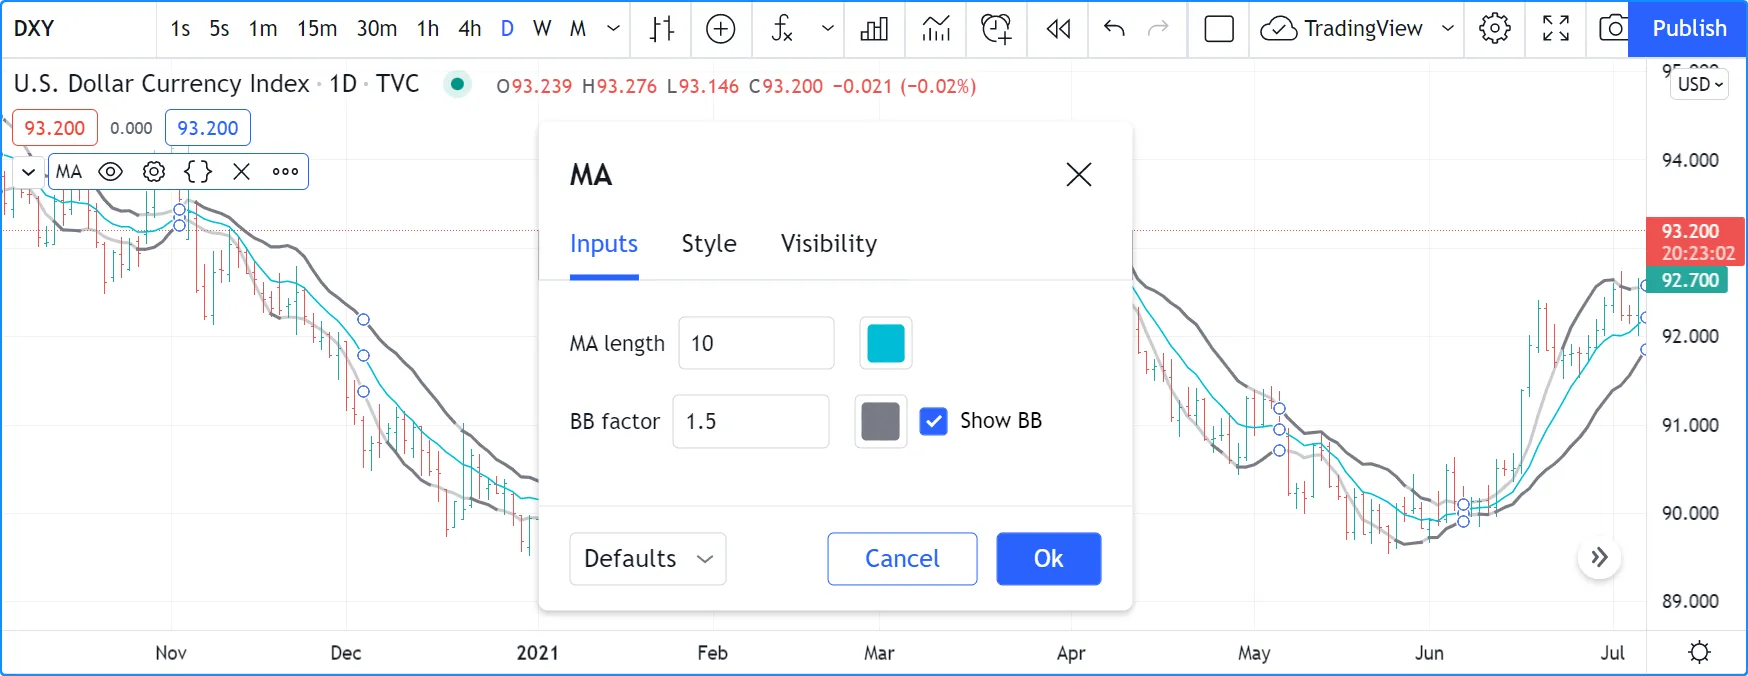
Note that:
- We have added two calls to
input.color()
to gather the values of the
maColorInputandbbColorInputvariables. We usemaColorInputdirectly in theplot(ma, "MA", maColorInput)call, and we usebbColorInputto build thebbHiColorandbbLoColorvariables, which modulate the transparency using the position of price relative to the BBs. We use a conditional value for thetranspvalue we call color.new() with, to generate different transparencies of the same base color. - We do not use a
titleargument for our new color inputs because they are on the same line as other inputs allowing users to understand to which plots they apply. - We have reorganized our
inlinearguments so they reflect the fact we have inputs grouped on two distinct lines.
String input
The input.string() function creates a string input with either a single-line text field or a dropdown menu of predefined text options. Other input.*() functions also return “string” values. However, most of them are specialized for specific tasks, such as defining timeframes, symbols, and sessions.
If a call to the input.string() function includes an options argument, it creates a dropdown menu containing the listed options. Otherwise, the call creates a text field that parses user-input text into a “string” value.
Like the input.text_area() function, the input.string() text can contain up to 40,960 characters, including horizontal whitespaces. However, because the input’s field in the “Settings/Inputs” tab is narrow, input.string() is best suited for defining small strings or for providing a quick set of input options for customizing calculations.
The simple script below contains two input.string() calls. The first call creates a text field for defining the timezone argument of two str.format_time() calls. It allows users to supply any text representing a time zone in UTC-offset or IANA formats. The second call creates a dropdown input with three preset options that determine the text shown in the drawn labels ("Open time", "Close time", or "Both"):
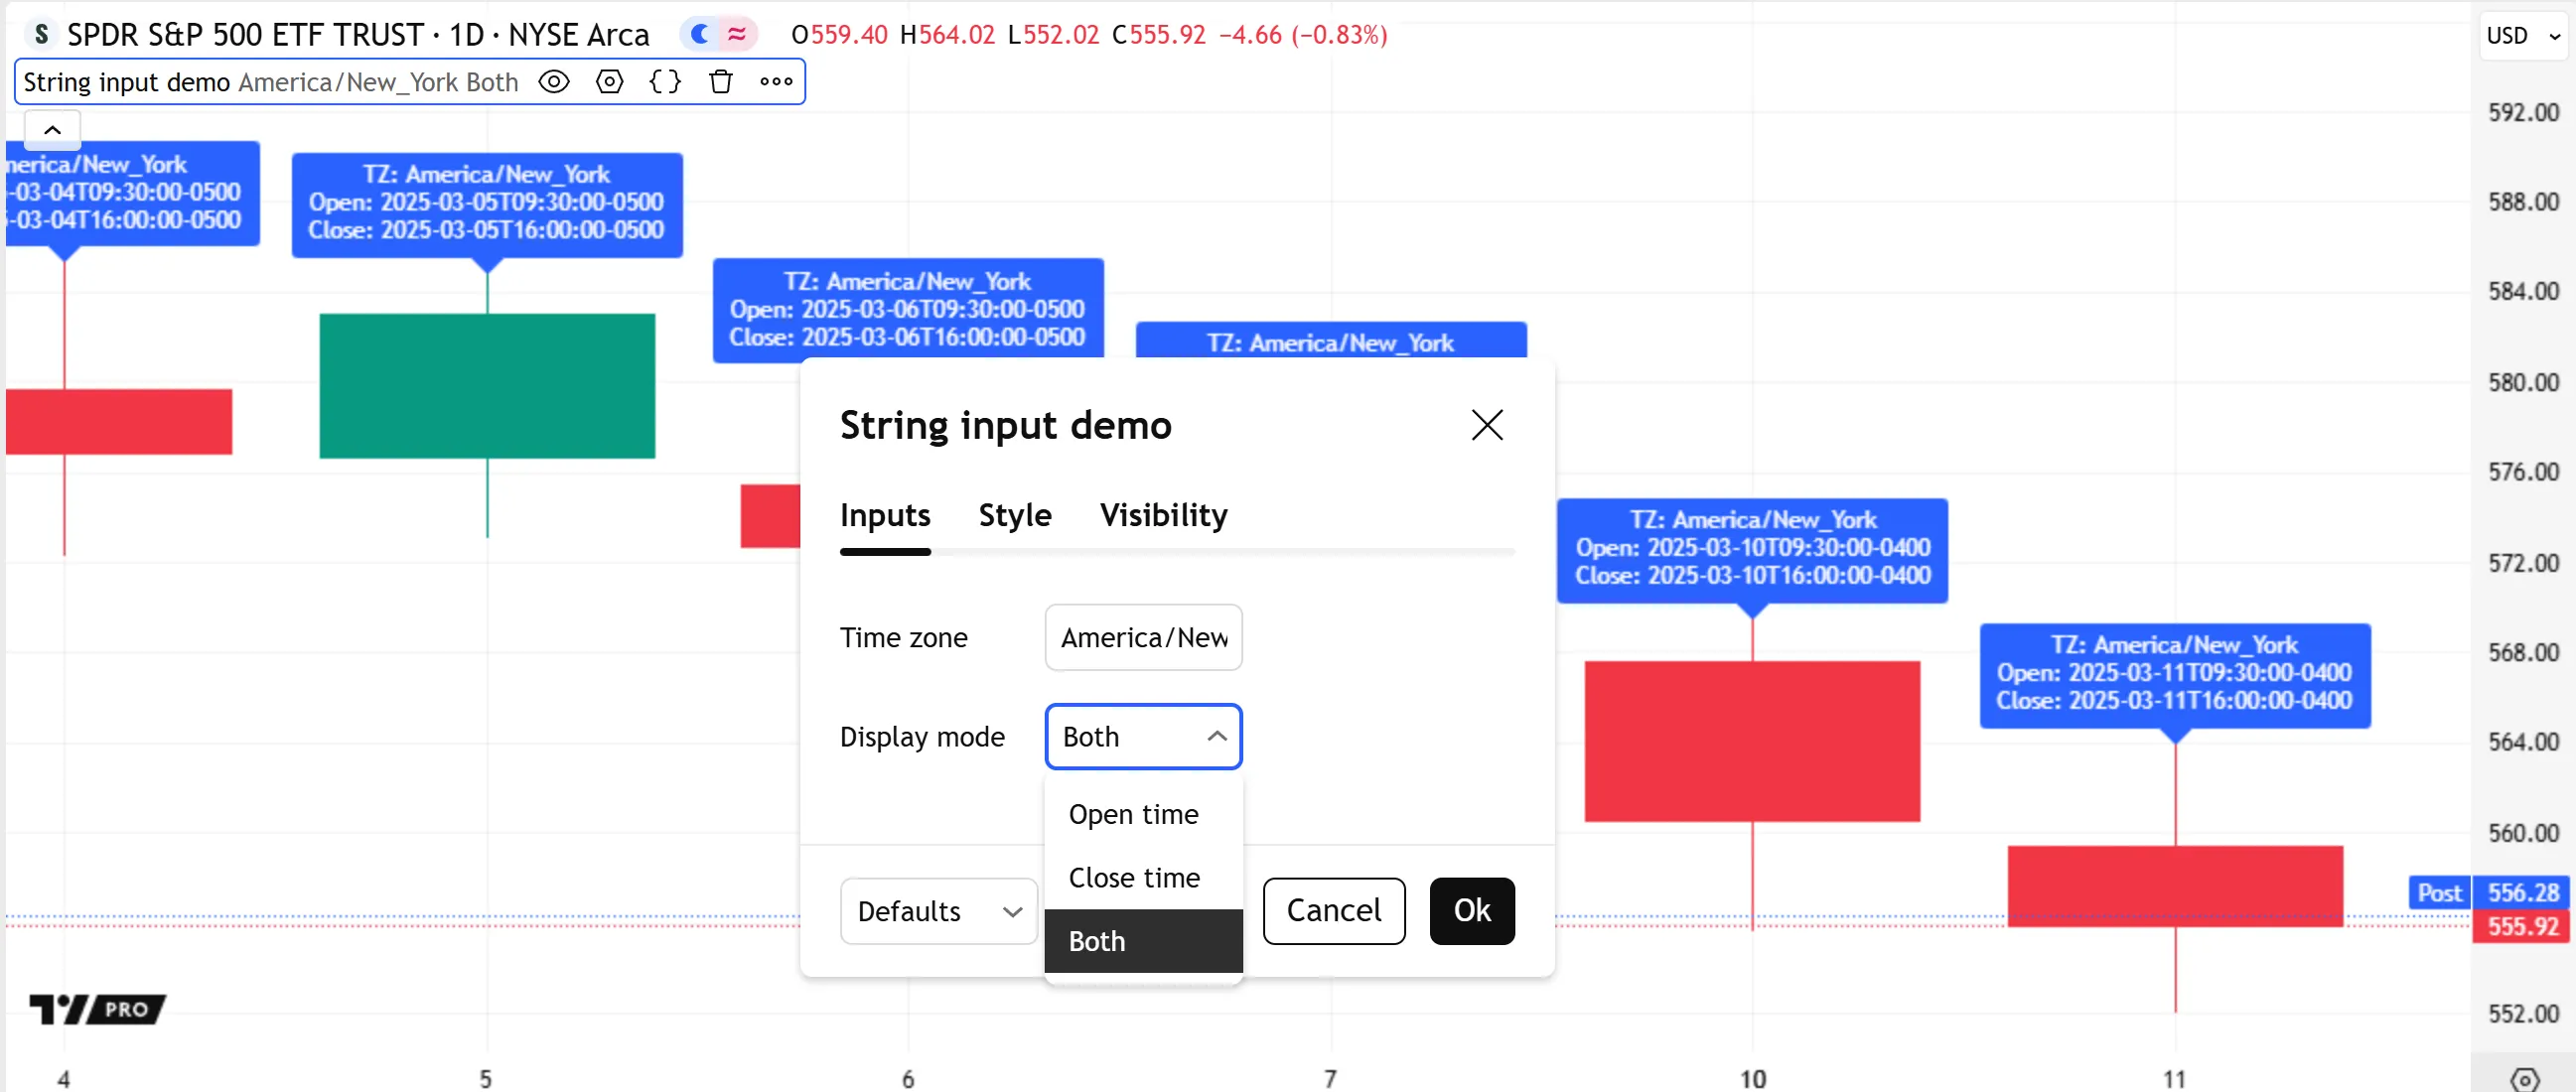
Note that:
- An alternative way to provide a strict list of input options is to use an enum input, which constructs a dropdown menu based on the members of an enum type.
- In contrast to string declarations in code, the text field from a string input treats an input backslash (
\) as a literal character. Therefore, the input.string() function does not parse input escape sequences such as\n.
Text area input
The input.text_area() function creates a text field for parsing user-specified text into a “string” value. The text field generated by this function is much larger than the field from input.string(). Additionally, it supports multiline text.
Programmers often use text area inputs for purposes such as alert customization and multi-parameter lists.
This example uses the value of a text area input to represent a comma-separated list of symbols. The script splits the parsed “string” value by its comma characters to construct an array of symbol substrings, then calls request.security() within a for…in loop on that array to dynamically retrieve the latest volume data for each specified symbol. On each loop iteration, the script converts the data to a “string” value with str.tostring() and displays the result in a table:
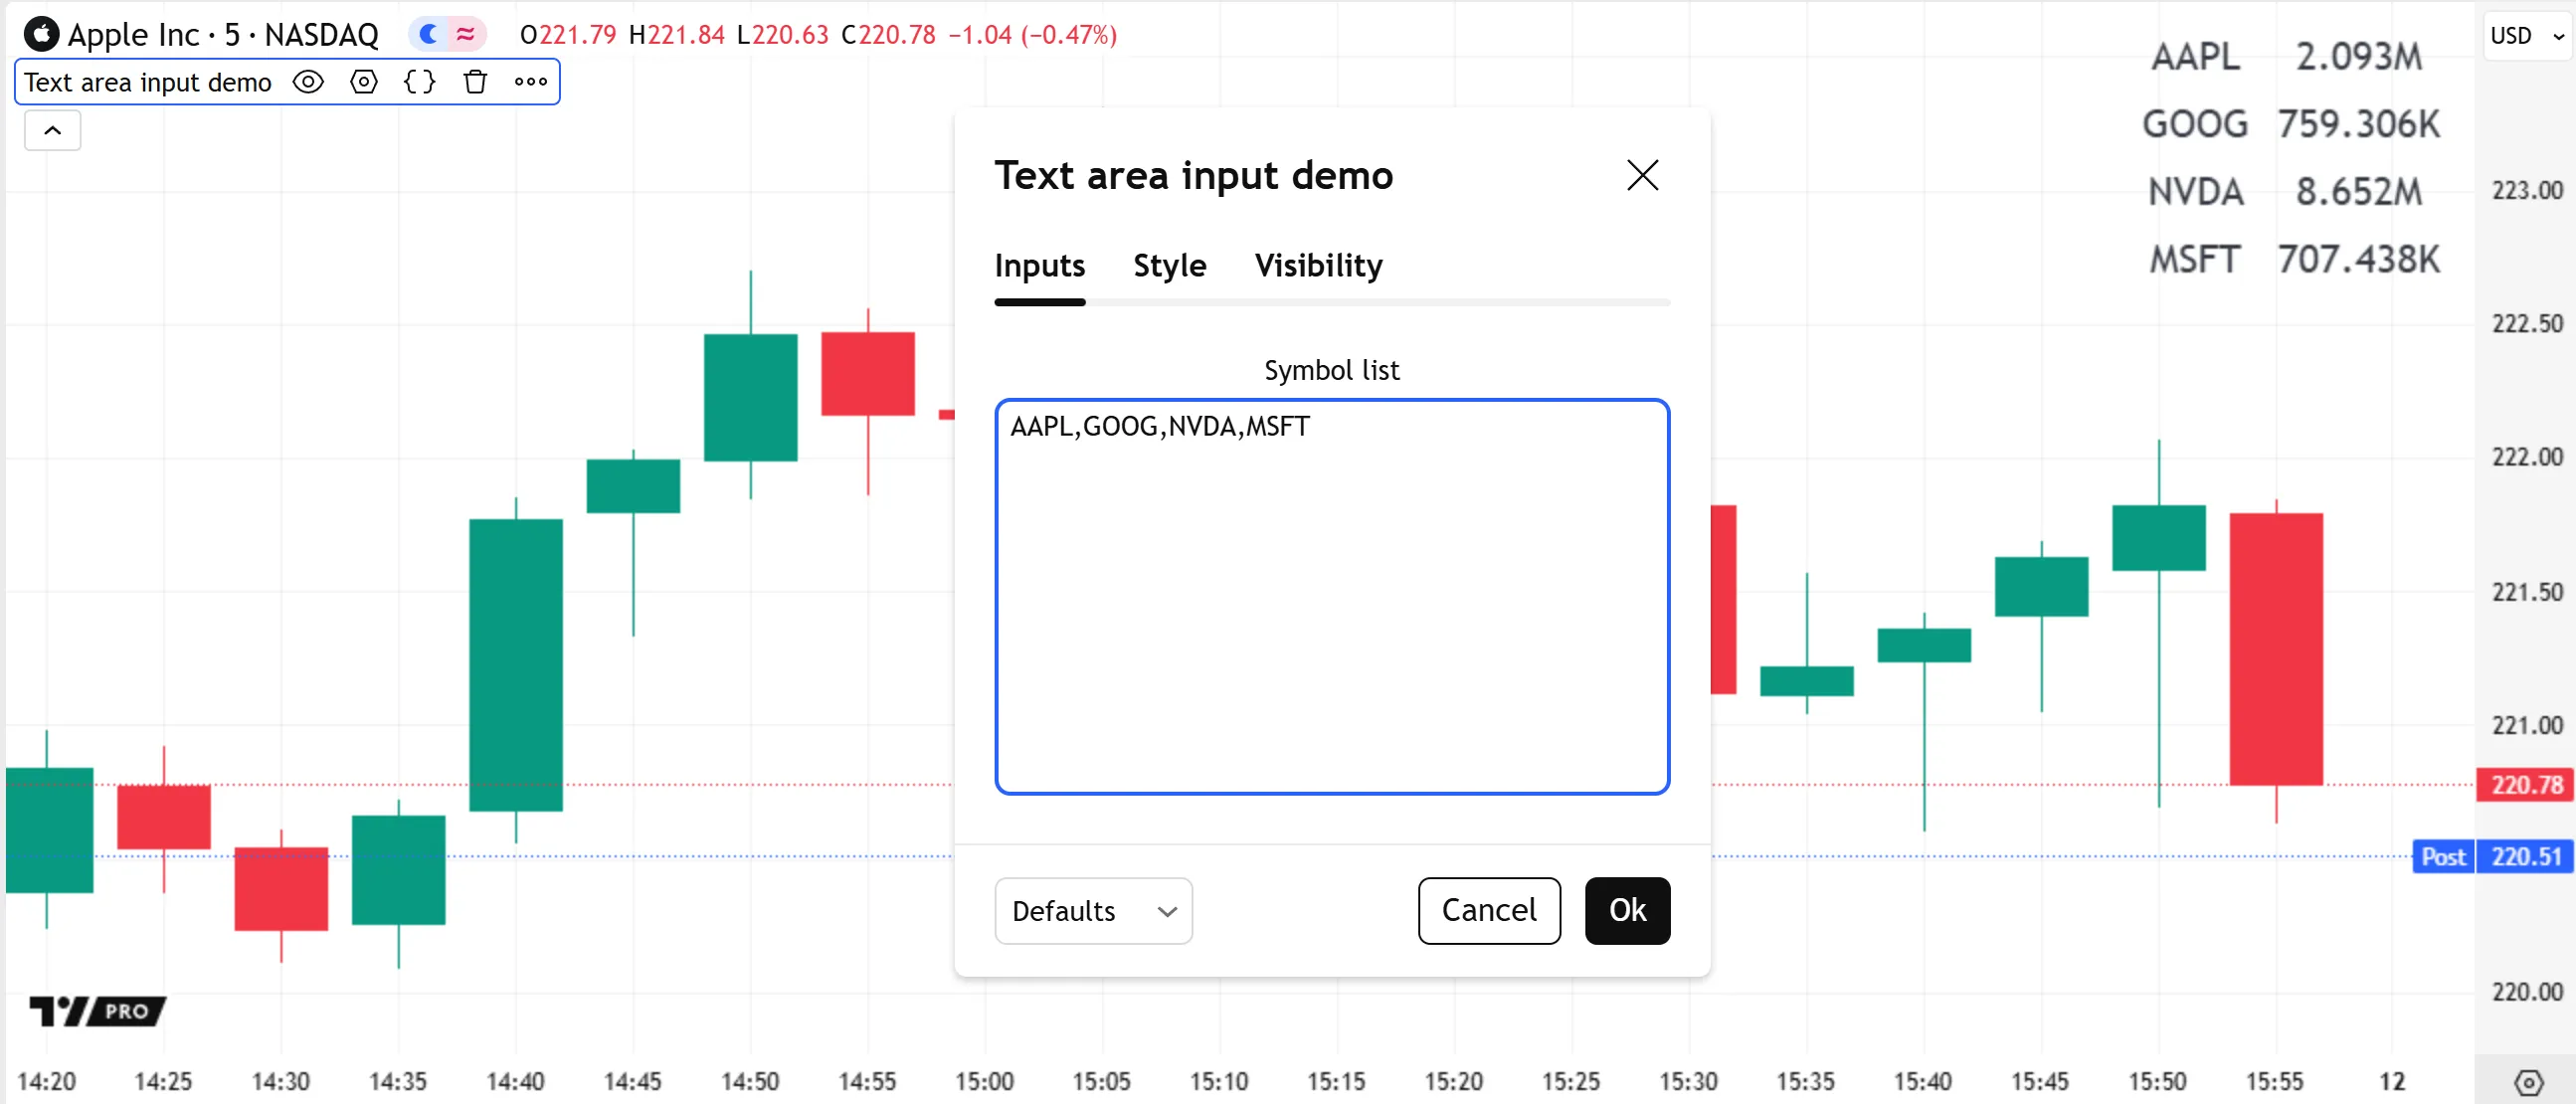
Note that:
- The script can use request.security() within a loop because dynamic requests are enabled by default.
- As with input.string(), the input.text_area() function’s text field treats backslashes (
\) as literal characters. It cannot process escape sequences. However, the field automatically parses any line terminators and tab spaces in the specified text. - Because text area inputs allow freeform, multiline text, it is often helpful to validate the input.text_area() function’s results to prevent erroneous user inputs. Refer to the Matching patterns section of the Strings page for an example that confirms an input symbol list using regular expressions.
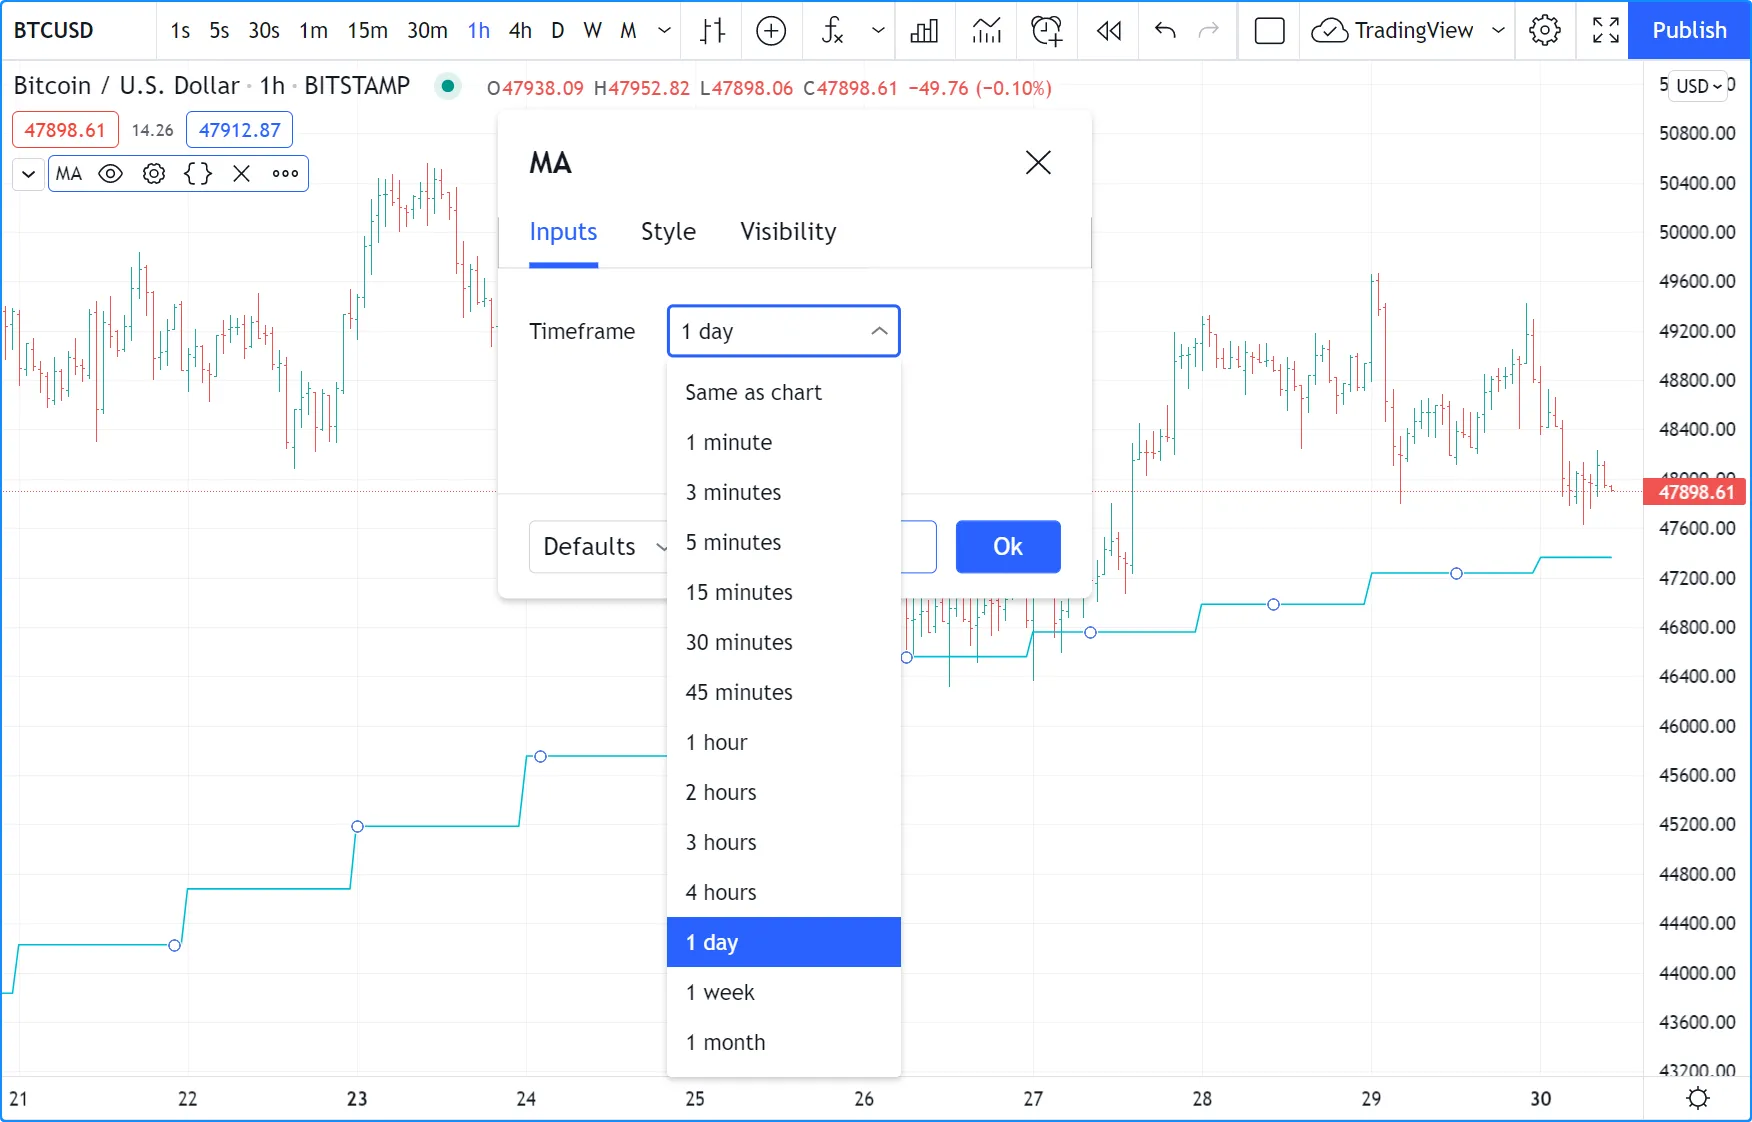
Timeframe input
The input.timeframe() function creates a dropdown input containing timeframe choices. It returns a “string” value representing the selected timeframe in our specification format, which scripts can use in request.*() calls to retrieve data from user-selected timeframes.
The following script uses request.security() on each bar to fetch the value of a ta.sma() call from a user-specified higher timeframe, then plots the result on the chart:
Note that:
- By default, the input.timeframe() call’s dropdown contains options for the chart’s timeframe and all timeframes listed in the chart’s “Time interval” menu. To restrict the available options to specific preset timeframes, pass a tuple of timeframe strings to the function’s
optionsparameter. - This script calls runtime.error() to raise a custom runtime error if the timeframe.in_seconds() value for the
tfInputtimeframe is less than the number of seconds in the main timeframe, preventing it from requesting lower-timeframe data. See this section of the Other timeframes and data page to learn more. - The request.security() call uses barmerge.lookahead_on as its
lookaheadargument, and it offsets theexpressionargument by one bar when thetfInputrepresents a higher timeframe to avoid repainting.
Symbol input
The input.symbol() function creates an input widget that mirrors the chart’s “Symbol Search” widget. It returns a “string” ticker identifier representing the chosen symbol and exchange, which scripts can use in request.*() calls to retrieve data from other contexts.
The script below uses request.security() to retrieve the value of a ta.rsi() call evaluated on a user-specified symbol’s prices. It plots the requested result on the chart in a separate pane:
Note that:
- The
defvalargument in the input.symbol() call is an empty “string”. When the request.security() call in this example uses this default value as thesymbolargument, it calculates the RSI using the chart symbol’s data. If the user wants to revert to the chart’s symbol after choosing another symbol, they can select “Reset settings” from the “Defaults” dropdown at the bottom of the “Settings” menu.
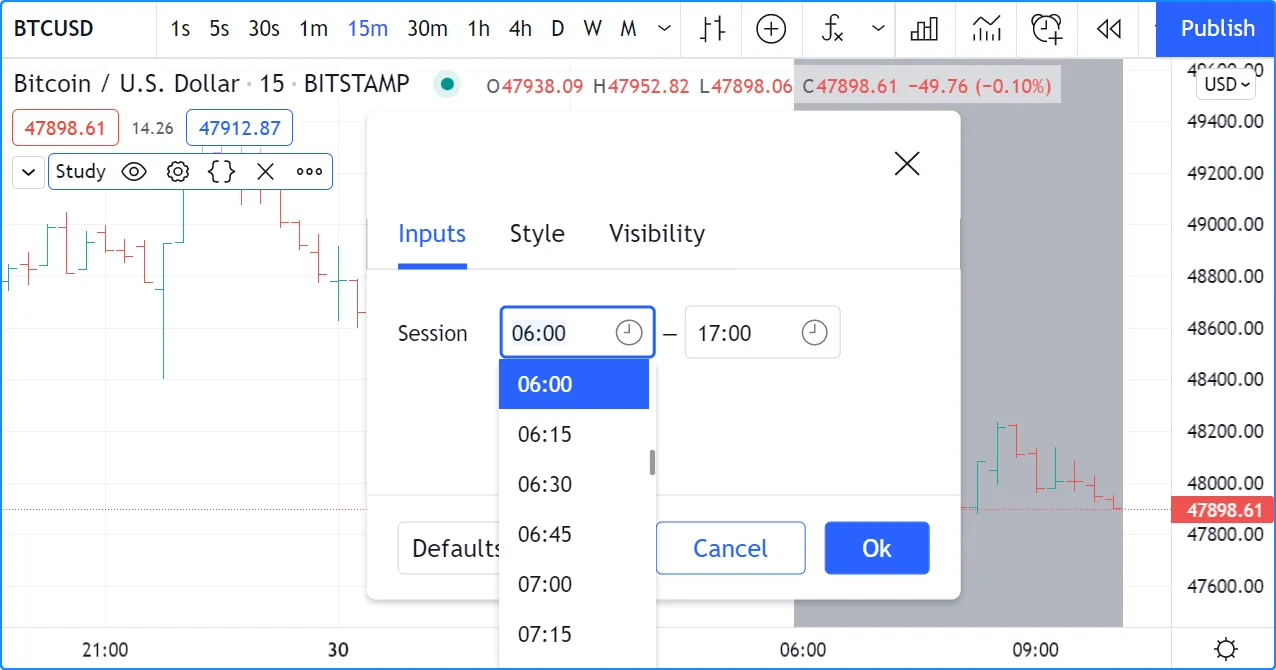
Session input
Session inputs are useful to gather start-stop values for periods of time. The input.session() built-in function creates an input widget allowing users to specify the beginning and end time of a session. Selections can be made using a dropdown menu, or by entering time values in “hh:mm” format.
The value returned by input.session() is a valid string in session format. See the manual’s page on sessions for more information.
Session information can also contain information on the days where the session is valid. We use an input.string() function call here to input that day information:
Note that:
- This script proposes a default session of “0600-1700”.
- The input.string() call uses a tooltip to provide users with help on the format to use to enter day information.
- A complete session string is built by concatenating the two strings the script receives as inputs.
- We explicitly declare the type of our two inputs with the string keyword to make it clear those variables will contain a string.
- We detect if the chart bar is in the user-defined session by calling
time()
with the session string. If the current bar’s
time
value (the time at the bar’s
open)
is not in the session,
time()
returns
na,
so
inSessionwill betruewhenever time() returns a value that is not na.
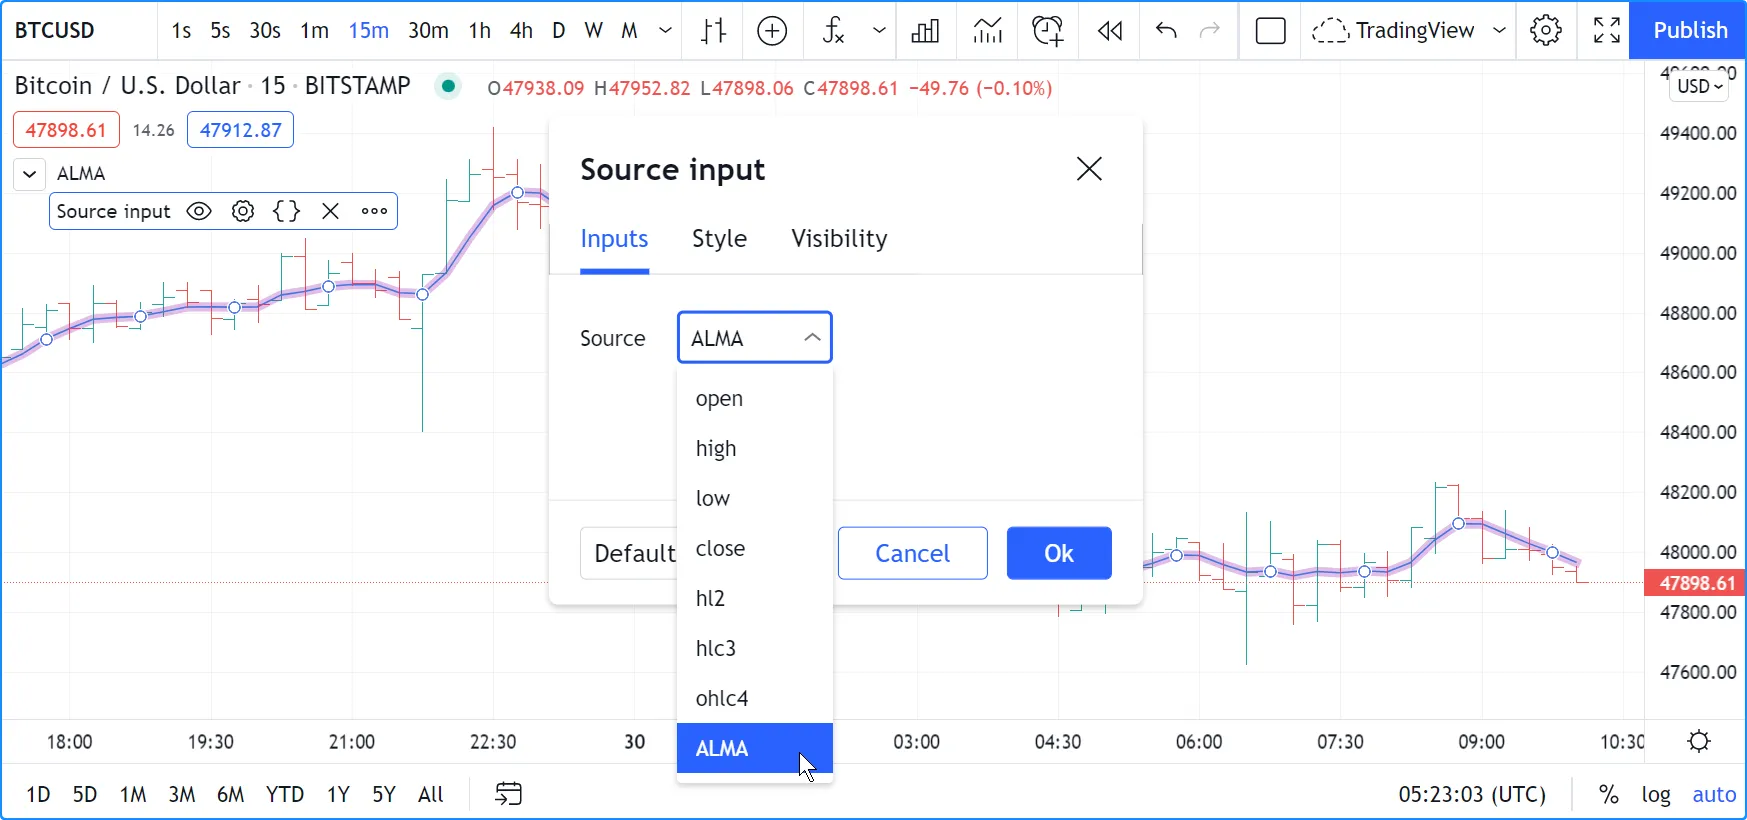
Source input
Source inputs are useful to provide a selection of two types of sources:
- Price values, namely: open, high, low, close, hl2, hlc3, and ohlc4.
- The values plotted by other scripts on the chart. This can be useful to “link” two or more scripts together by sending the output of one as an input to another script.
This script simply plots the user’s selection of source. We propose the high as the default value:
This shows a chart where, in addition to our script, we have loaded an “Arnaud Legoux Moving Average” indicator. See here how we use our script’s source input widget to select the output of the ALMA script as an input into our script. Because our script plots that source in a light-purple thick line, you see the plots from the two scripts overlap because they plot the same value:
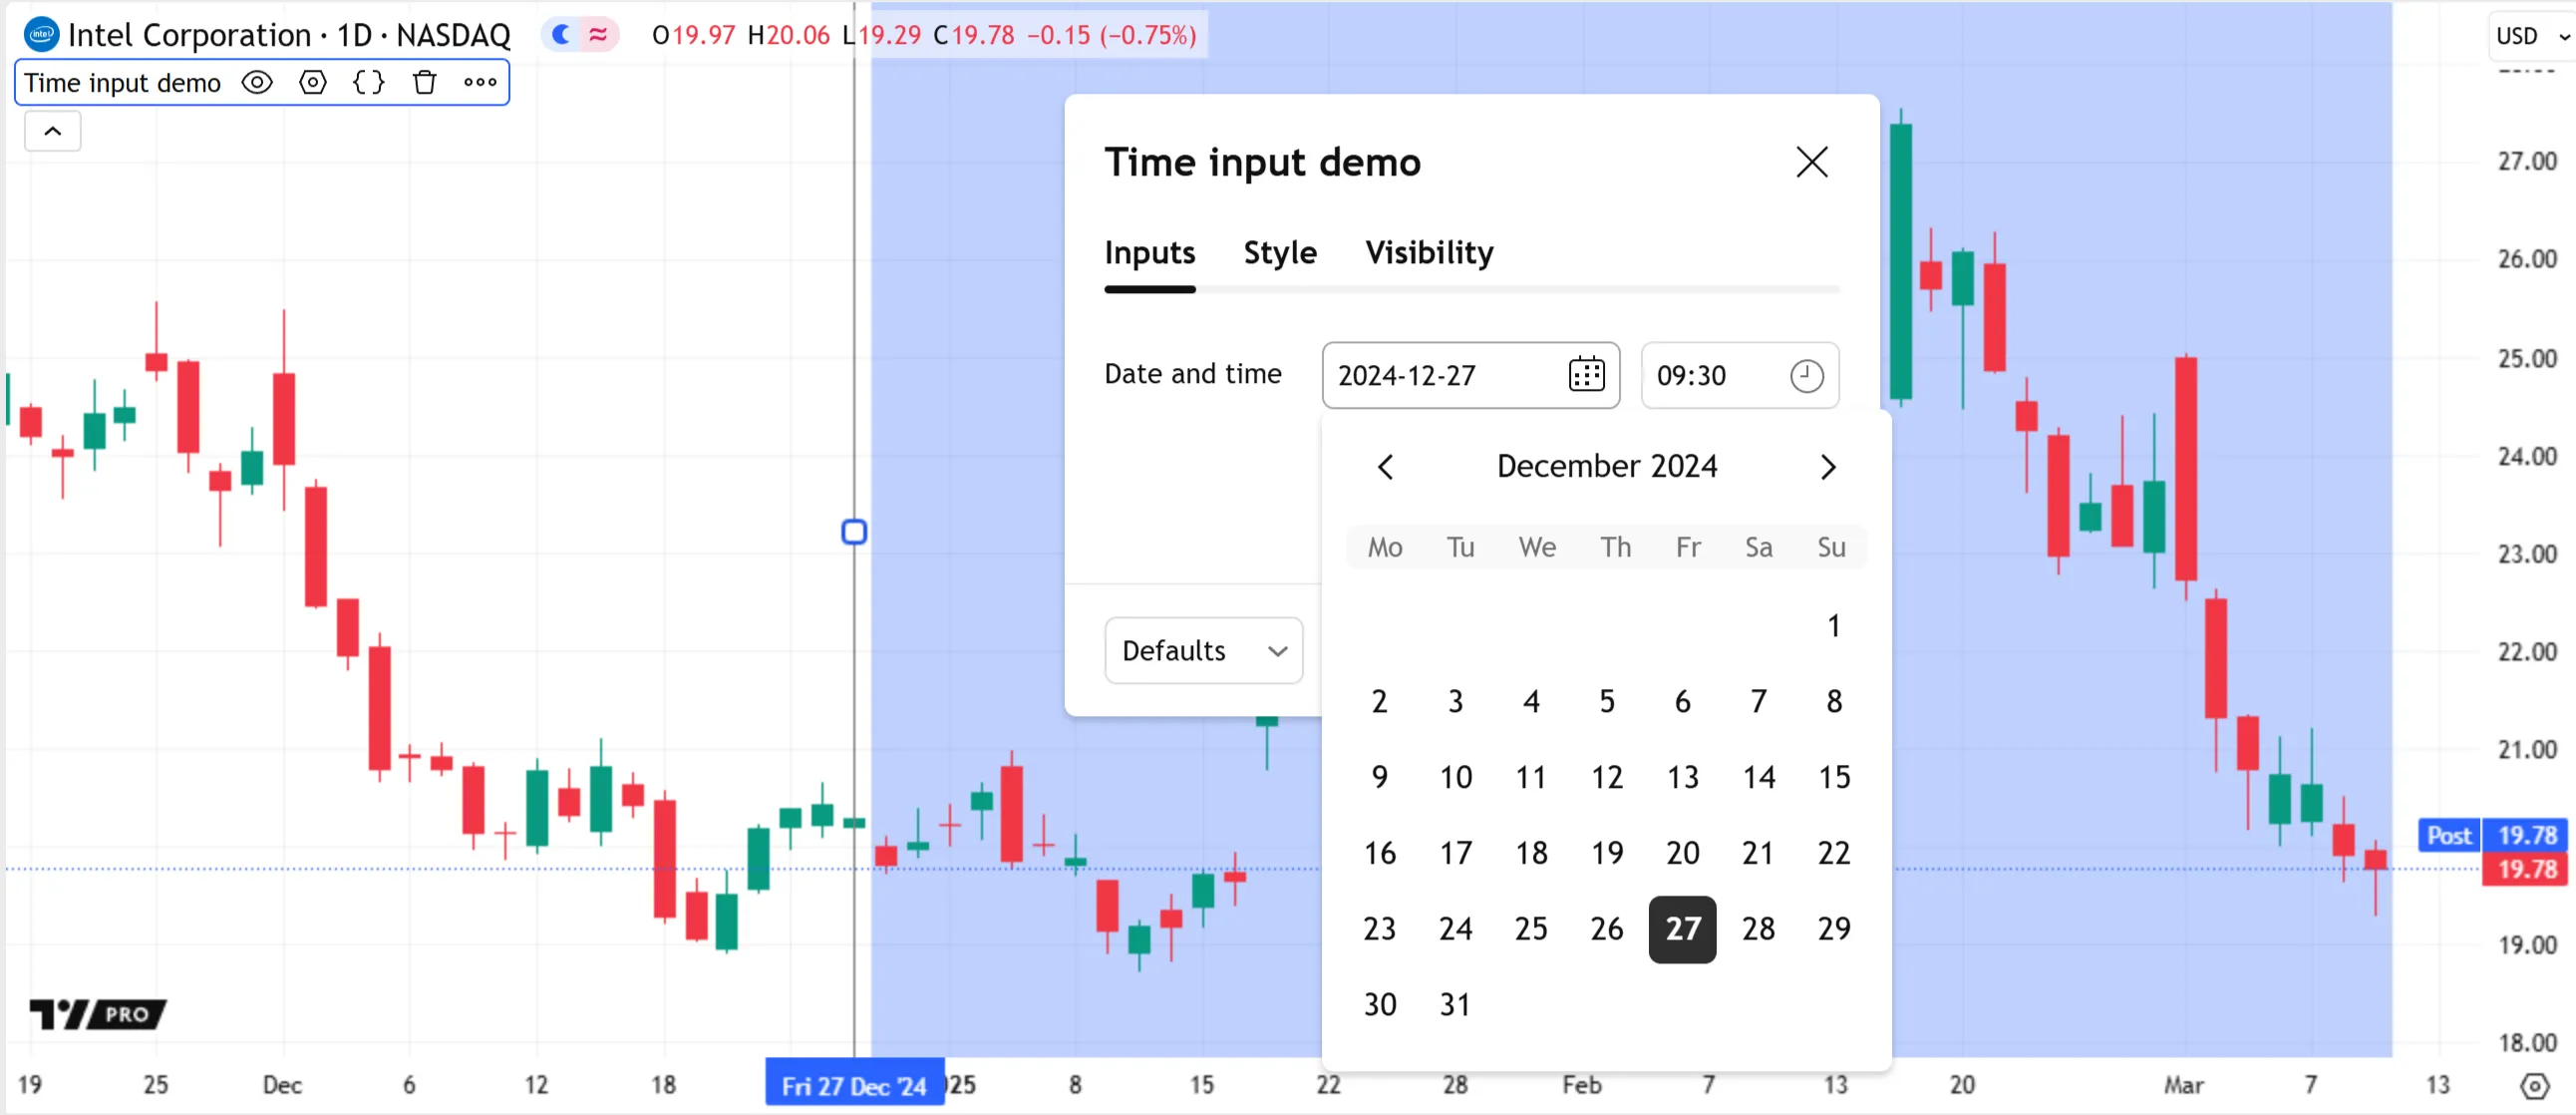
Time input
The input.time() function creates a time input, which converts a user-specified date and time, in the chart’s time zone, into a time zone-agnostic UNIX timestamp. The timestamp represents the absolute number of milliseconds elapsed since 00:00:00 UTC on January 1, 1970. The input’s defval argument can be any “const int” value, including the value returned by the single-argument overload of the timestamp() function.
The input.time() function generates two fields: one for the date and the other for the time of day. Additionally, it adds a vertical marker to the chart. Users can change the input time either by moving this marker or by updating the value in the “Settings/Inputs” tab.
This simple script highlights the chart background for each bar whose opening time is past the date and time specified in a time input’s fields. This script defines the input.time() call’s default argument as the result of a timestamp() call that calculates the UNIX timestamp corresponding to December 27, 2024, at 09:30 in UTC-5:
Note that:
- The vertical line to the left of the background highlight is visible when selecting the script’s status line or opening the “Settings” menu. Moving this line changes the input timestamp. Users can also change the time by choosing “Reset points” from the script’s “More” menu and selecting a new point directly on the chart.
- Changing the time zone in the chart’s settings can change the values shown in the input fields. However, the underlying UNIX timestamp does not change because it is unaffected by time zones.
- Users can pair time inputs with price inputs to create interactive chart points. See the next section to learn more.
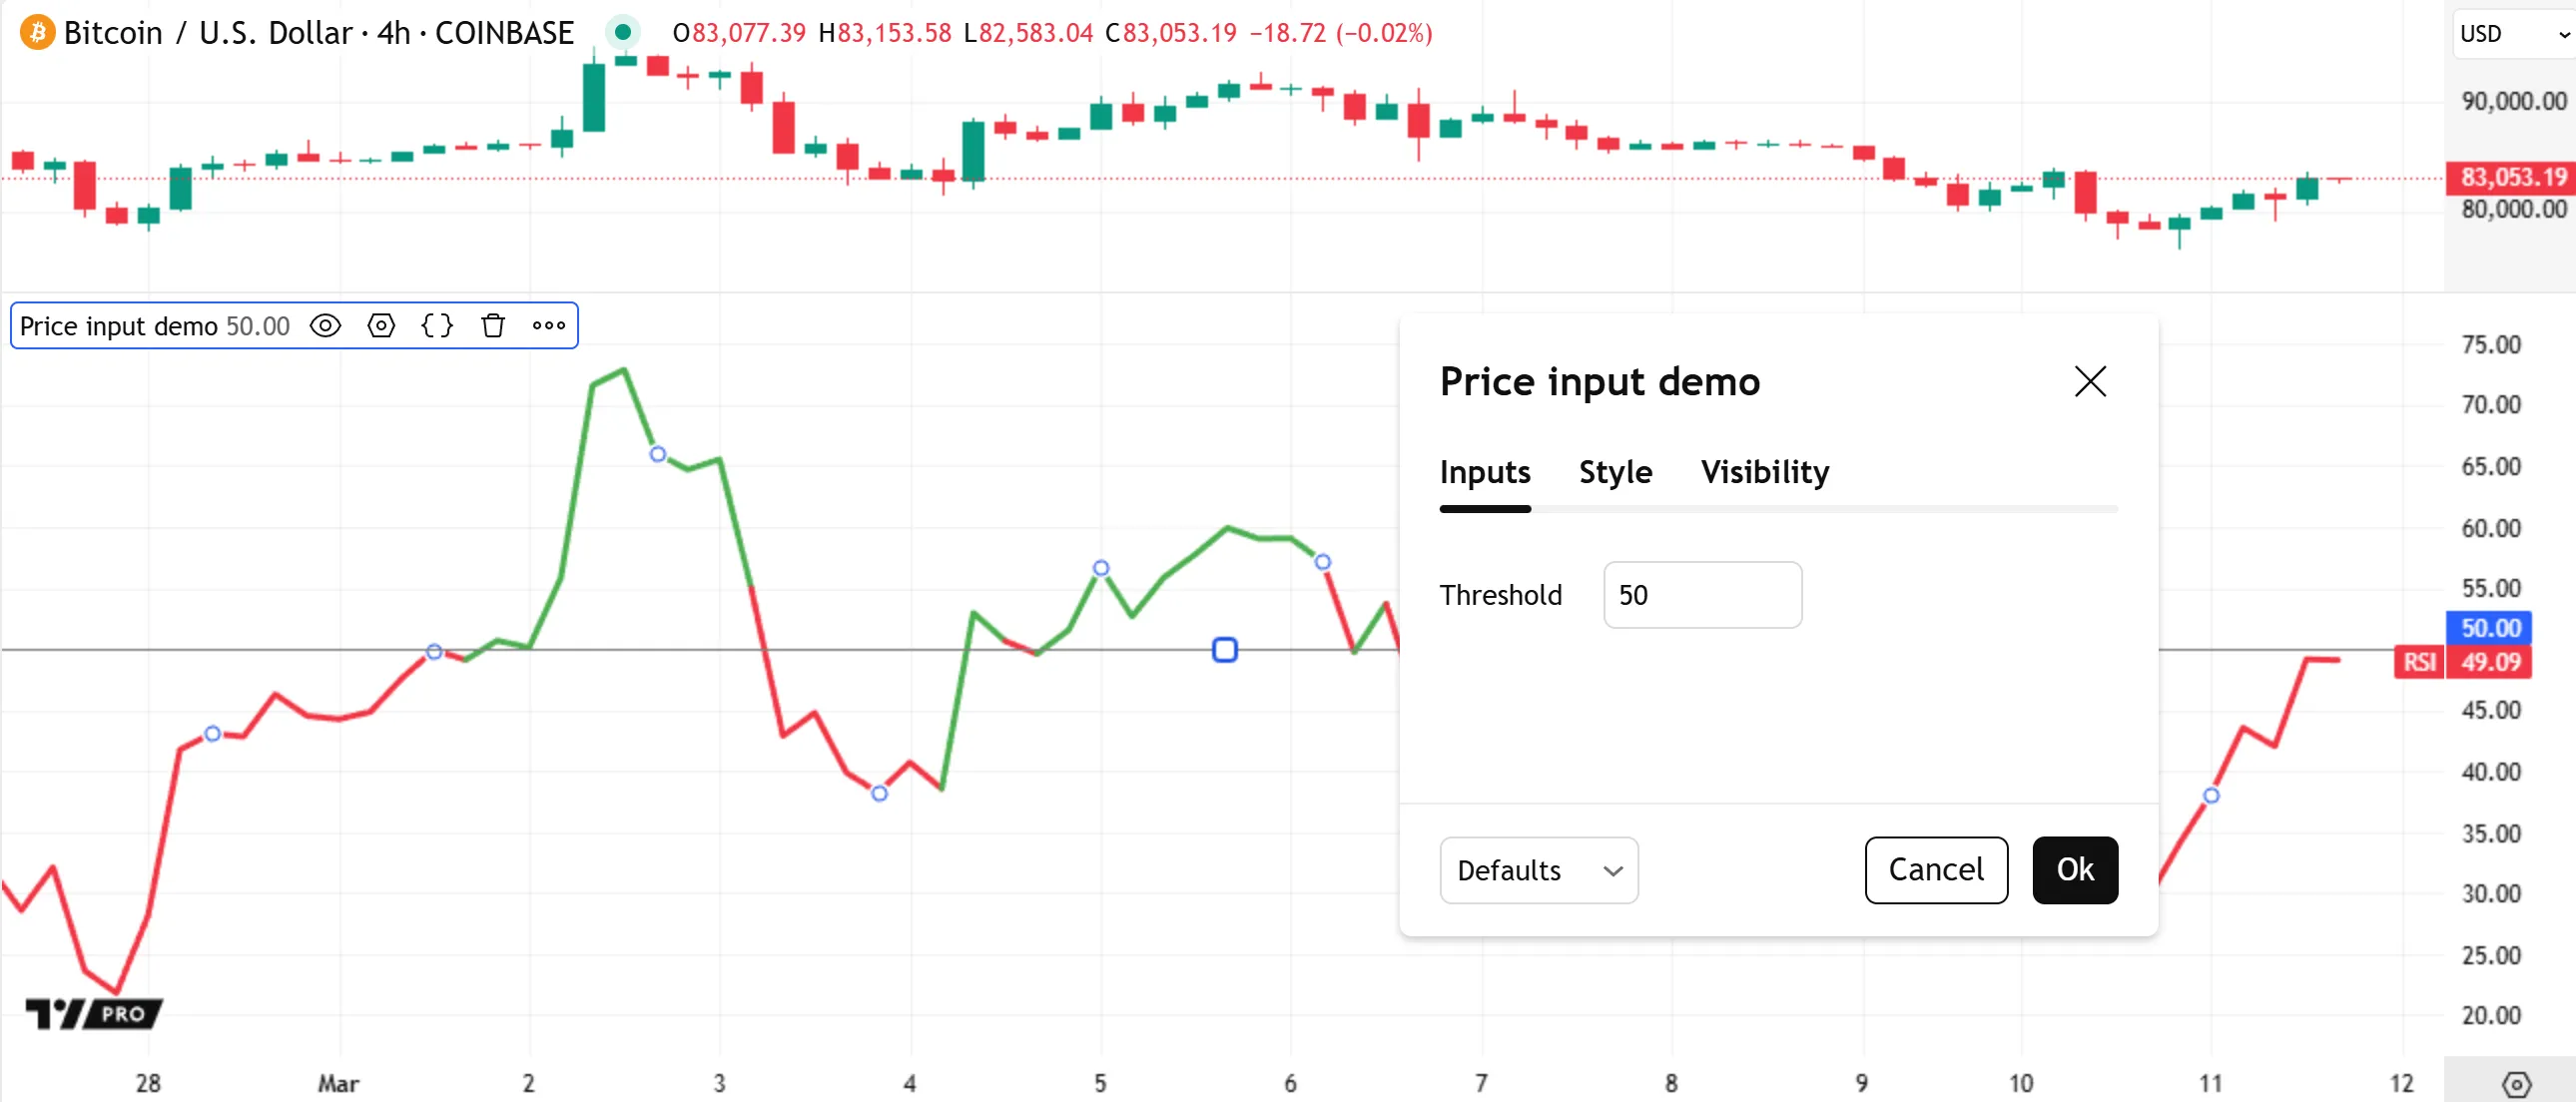
Price input
The input.price() function creates a price input, which returns a specified floating-point value, similar to the input.float() function. Additionally, it adds a horizontal marker to the chart, allowing users to adjust the “float” value graphically, without opening the “Settings/Inputs” tab.
For example, this script calculates an RSI and plots the result with different colors based on the thresholdInput value. The plot is green if the RSI is above the value. Otherwise, it is red. Unlike a standard float input, users can set this script’s input value by dragging the input’s horizontal marker up or down on the chart:
Programmers can also pair price inputs and time inputs to add interactive points for custom calculations or drawings. When a script creates pairs of time and price inputs that belong to the same group, and each pair has a unique, matching inline argument, it adds point markers on the chart instead of separate horizontal and vertical markers. Users can move these point markers to adjust input price and time values simultaneously.
This example creates four pairs of price and time inputs with distinct inline values. Each input includes confirm = true, meaning that users set the values when they add the script to a chart. The script prompts users to set four time-price points, then draws a closed polyline that passes through all the valid chart locations closest to the specified coordinates:
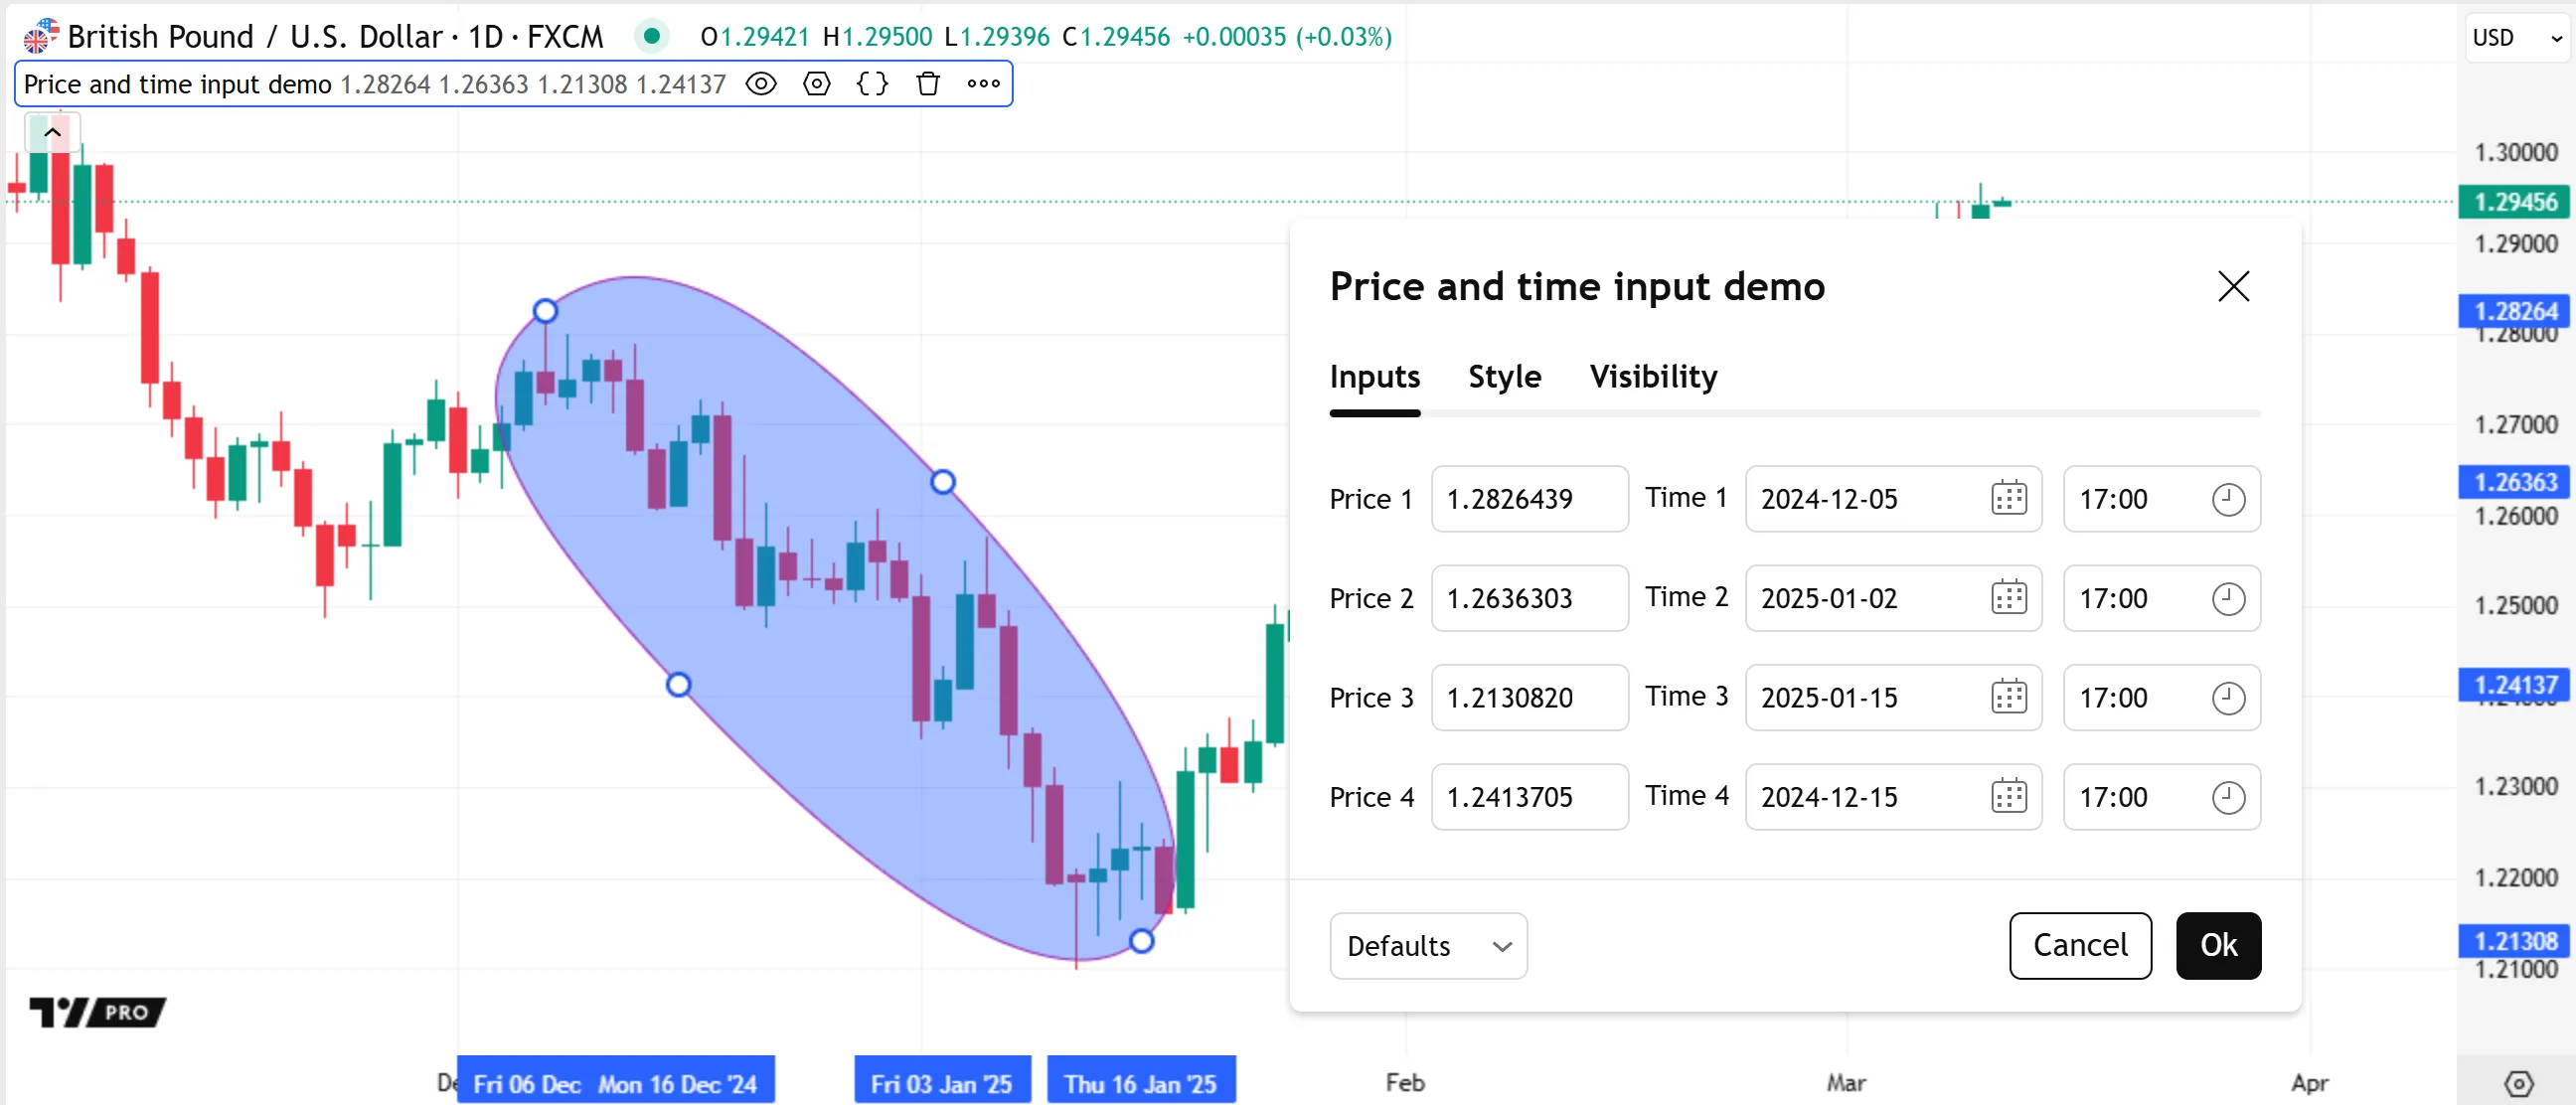
Note that:
- Setting input times and prices together is possible only if there is exactly one input pair per
inlinevalue. If the inputs do not includeinlinearguments, or if more inputs have the same argument, the script sets times and prices separately. - The script creates the drawing by constructing an array of chart points, then using that array in a polyline.new() call. Refer to the Polylines section of the Lines and boxes page to learn more about polyline drawings.
Enum input
The
input.enum()
function creates a dropdown input that displays field titles
corresponding to distinct members (possible values) of an
enum type. The function returns one of the unique, named values from a
declared enum, which scripts
can use in calculations and logic requiring more strict control over
allowed values and operations. Supply a list of enum members to the
options parameter to specify the members users can select from the
dropdown. If one does not specify an enum field’s title, its title is
the “string” representation of its name.
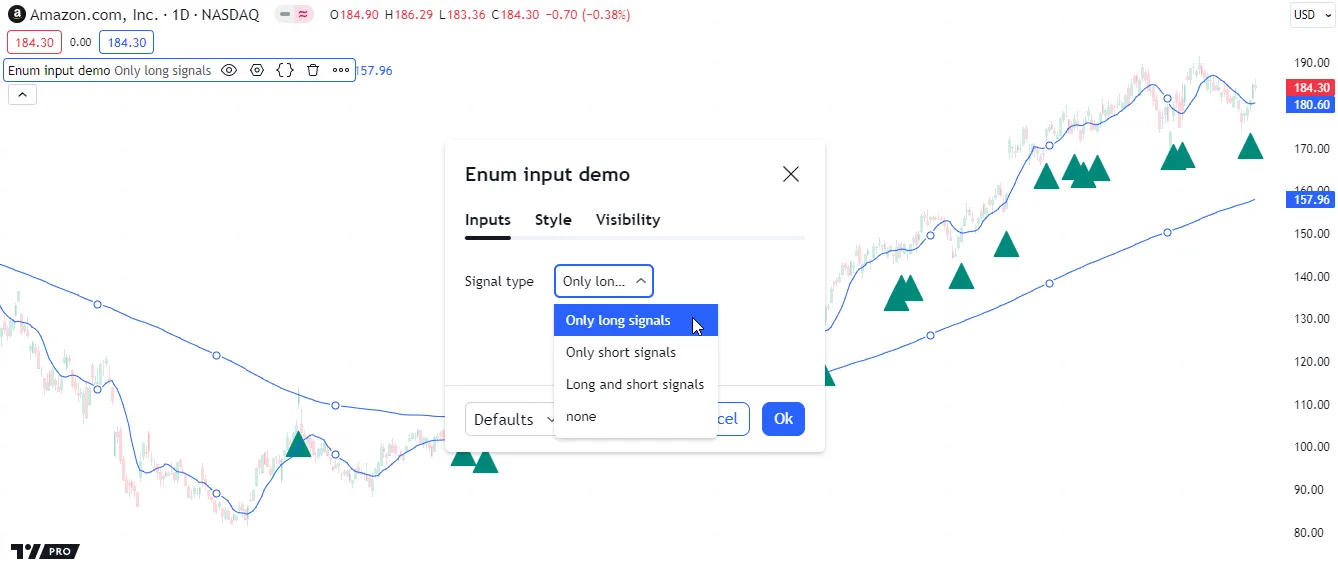
This example declares a SignalType enum with four fields representing
named signal display modes: long, short, both, and none. The
script uses a member of this
enum type as the defval argument in the
input.enum()
call to generate a dropdown in the “Inputs” tab, allowing users to
select one of the enum’s titles to control which signals it displays on
the chart:
Note that:
- The
sigInputvalue is theSignalTypemember whose field contains the selected title. - Since we did not specify a title for the
nonefield of the enum, its title is the “string” representation of its name (“none”), as we see in the above image of the enum input’s dropdown.
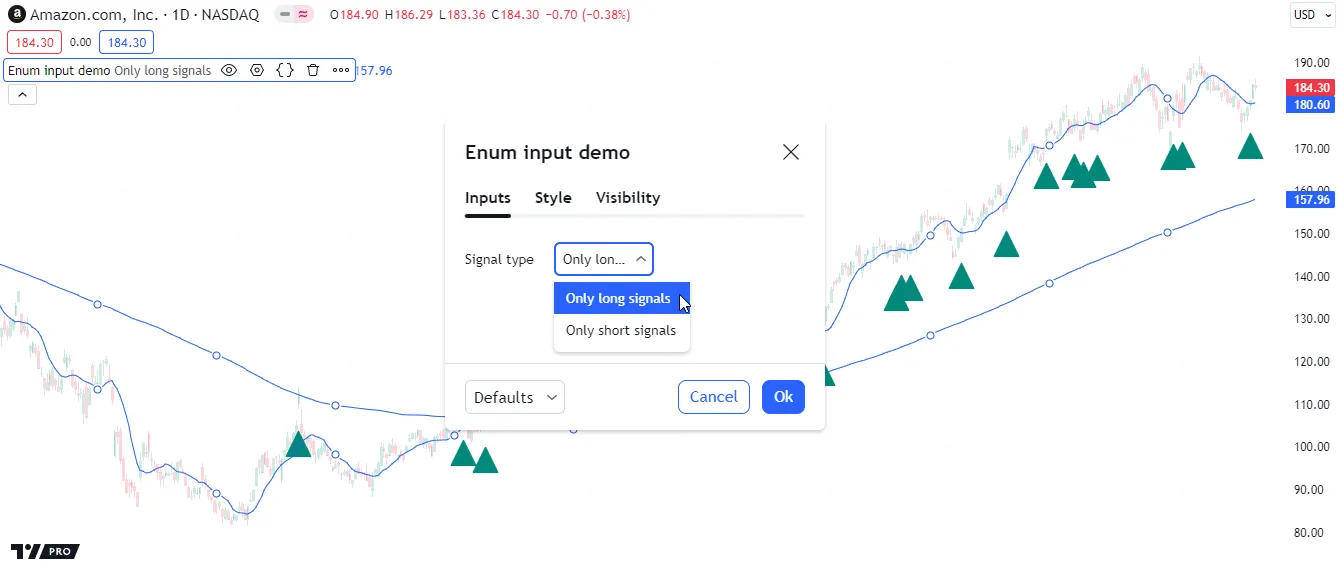
By default, an enum input displays the titles of all an enum’s members
within its dropdown. If we supply an options argument to the
input.enum()
call, it will only allow users to select the members included in that
list, e.g.:
The above options argument specifies that users can only view and
select the titles of the long and short fields from the SignalType
enum. No other options are allowed:
Other features affecting inputs
Some parameters of the
indicator()
and
strategy()
functions populate a script’s “Settings/Inputs” tab with additional
inputs. These parameters are timeframe, timeframe_gaps, and
calc_bars_count. For example:
Tips
The design of your script’s inputs has an important impact on the usability of your scripts. Well-designed inputs are more intuitively usable and make for a better user experience:
- Choose clear and concise labels (your input’s
titleargument). - Choose your default values carefully.
- Provide
minvalandmaxvalvalues that will prevent your code from producing unexpected results, e.g., limit the minimal value of lengths to 1 or 2, depending on the type of MA you are using. - Provide a
stepvalue that is congruent with the value you are capturing. Steps of 5 can be more useful on a 0-200 range, for example, or steps of 0.05 on a 0.0-1.0 scale. - Group related inputs on the same line using
inline; bull and bear colors for example, or the width and color of a line. - When you have many inputs, group them into meaningful sections using
group. Place the most important sections at the top. - Do the same for individual inputs within sections.
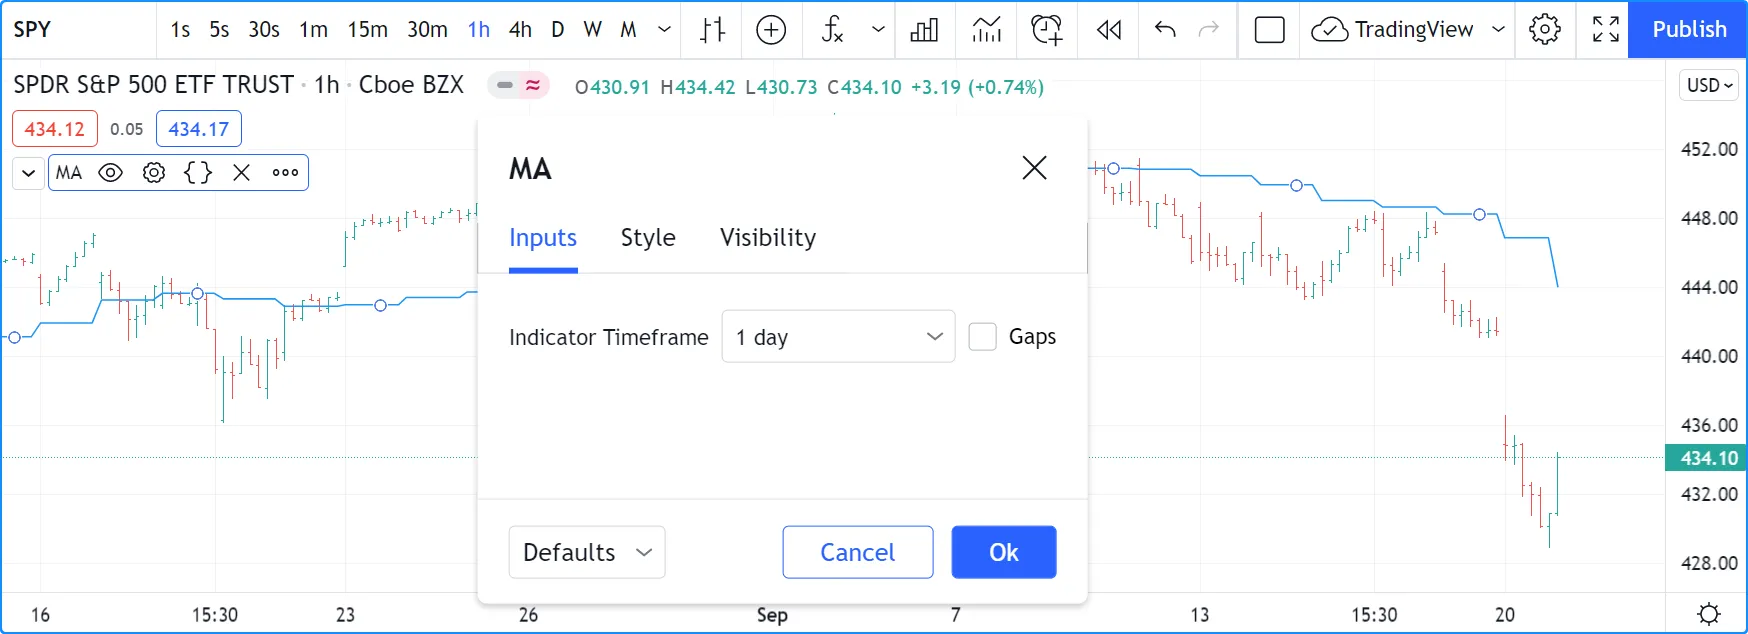
It can be advantageous to vertically align different arguments of
multiple input.*() calls in your code. When you need to make global
changes, this will allow you to use the Editor’s multi-cursor feature
to operate on all the lines at once.
It is sometimes necessary to use Unicode spaces to achieve optimal alignment in inputs. This is an example:
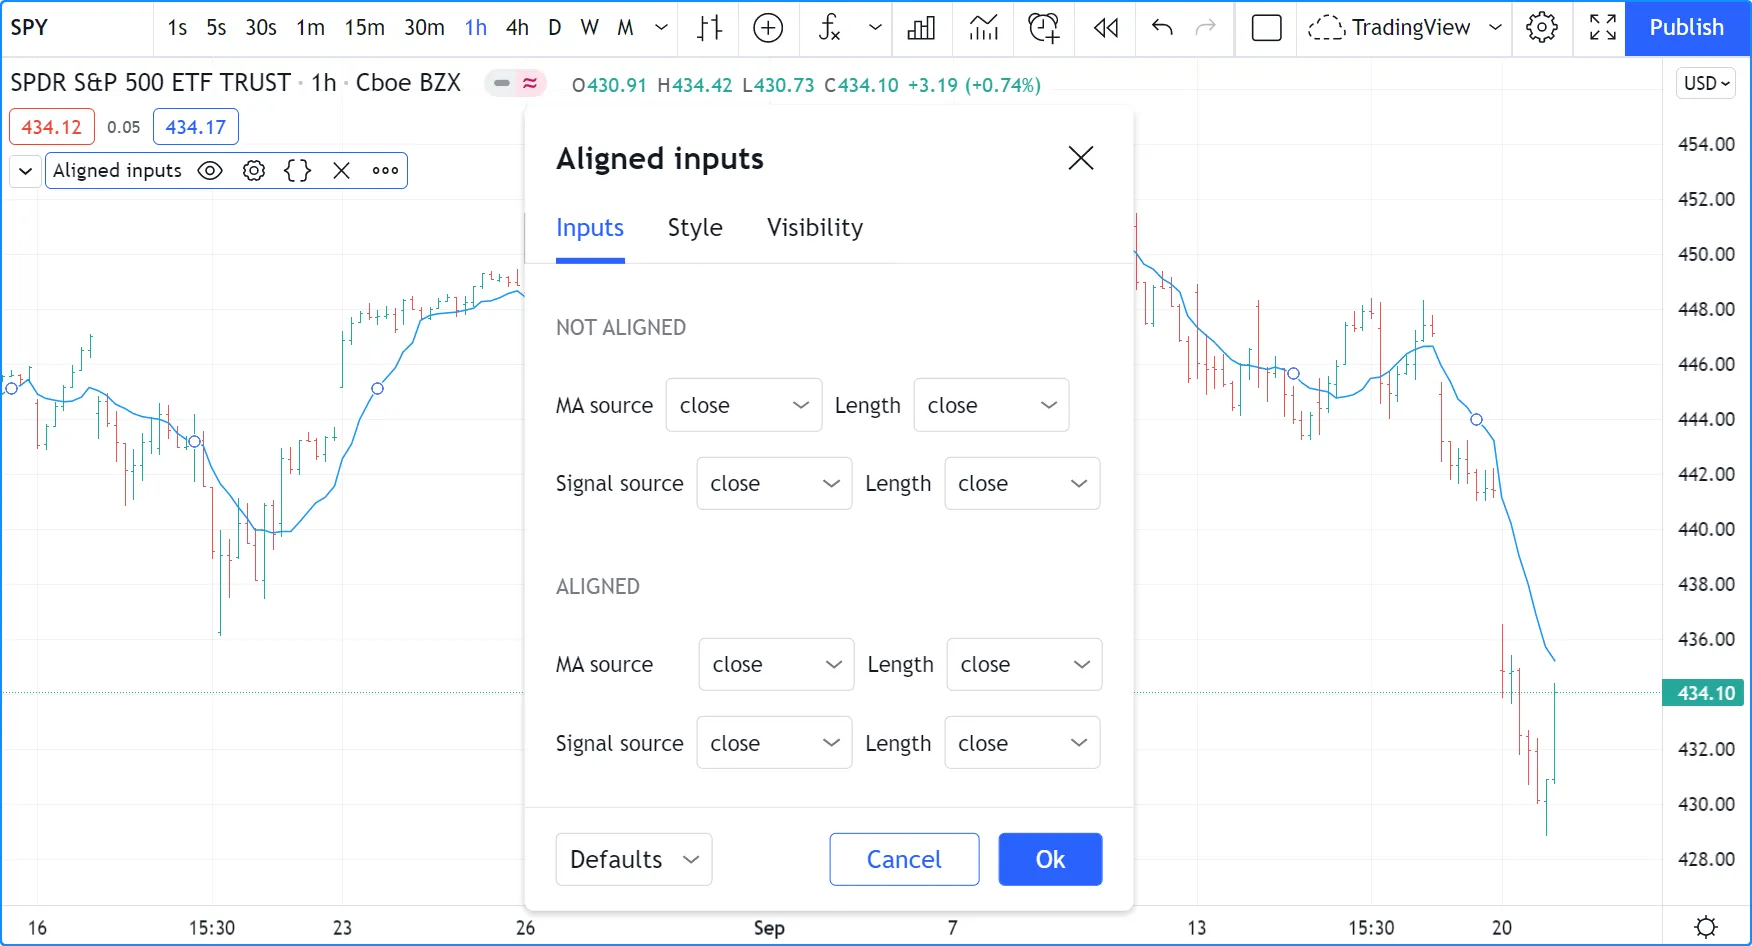
Note that:
- We use the
groupparameter to distinguish between the two sections of inputs. We use a constant to hold the name of the groups. This way, if we decide to change the name of the group, we only need to change it in one place. - The first sections inputs widgets do not align vertically. We are
using
inline, which places the input widgets immediately to the right of the label. Because the labels for thema1SourceInputandlong1SourceInputinputs are of different lengths the labels are in different y positions. - To make up for the misalignment, we pad the
titleargument in thema2SourceInputline with three Unicode EN spaces (U+2002). Unicode spaces are necessary because ordinary spaces would be stripped from the label. You can achieve precise alignment by combining different quantities and types of Unicode spaces. See here for a list of Unicode spaces of different widths.