How does the layout system work in regards to saving, storing and managing my charts?
Yes, our whole "layout" concept and terminology can be a bit confusing and vague to be fair but that's what stuck through the years and most people are used to it now, so please bear with me for a moment and brace yourself - a long explanation is ahead.
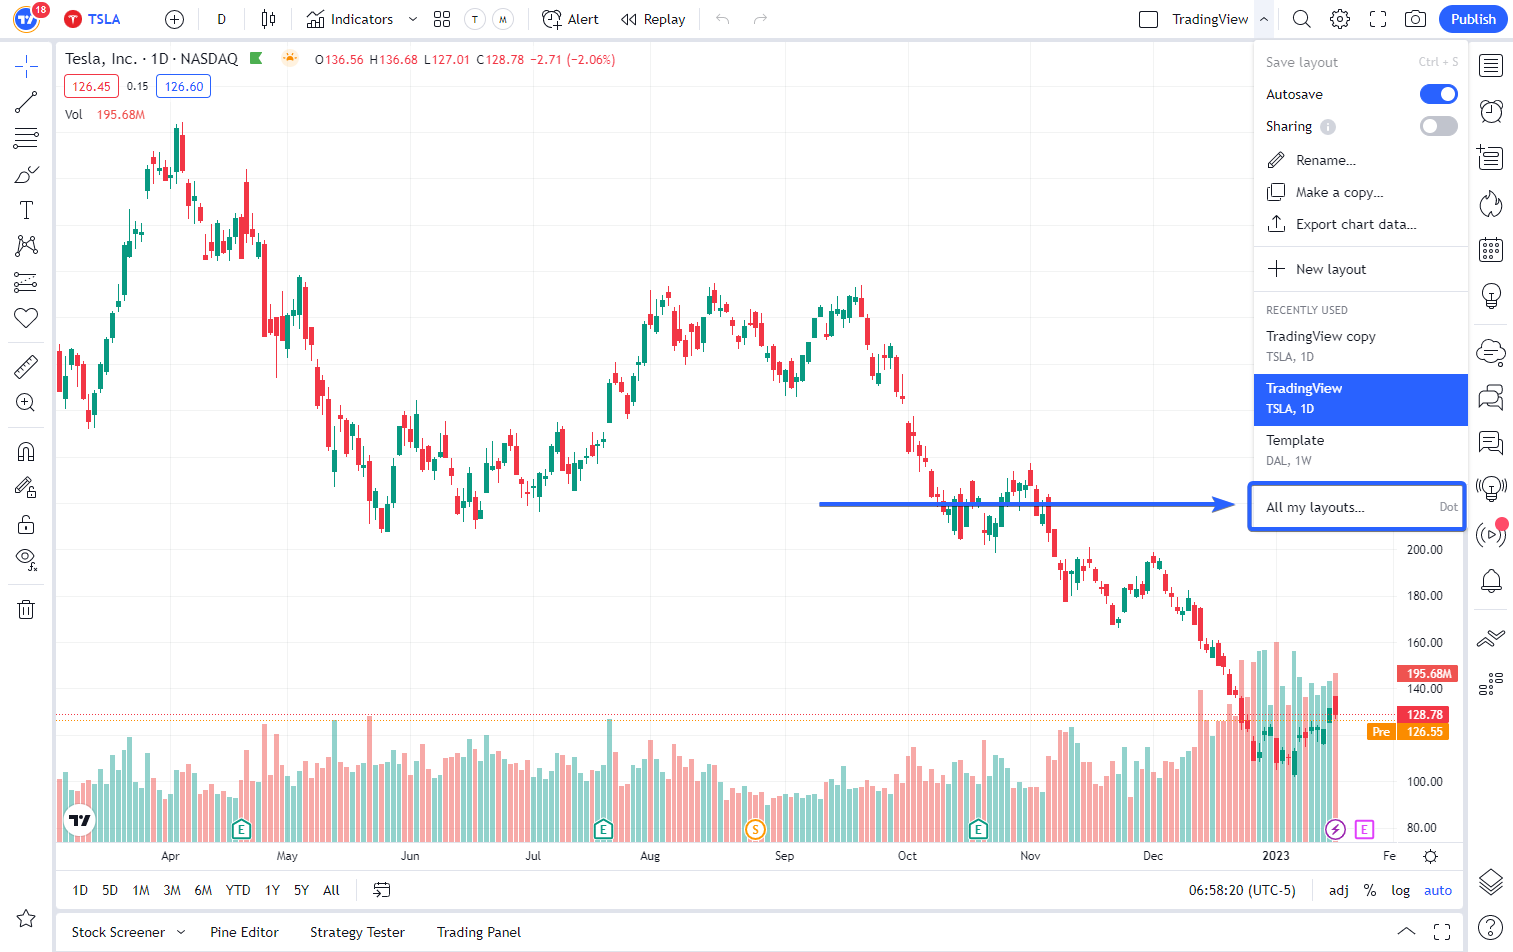
Alright, how does this chart layout system operate and how it relates to my saved charts?
One of the easiest way to understand chart layouts is to think of them as of separately saved work spaces or document folders; thus when you create a new layout, you create a new folder or a new working space basically.

Then you create and save different charts of different symbols/tickers within that workspace, akin to creating new Google docs or MS Word documents within a folder. That was originally the point of having layouts: to have different, independent work spaces that are not in sync with each other.
This means that, more often than not, there's no real need to save 10 different layouts, unless you need to have several different AAPL charts for instance. Even then you can have different charts of the same ticker when you go to a multi-chart layout (more on that later). And there's usually no point in naming a layout after a ticker. Yes. layouts do display the last ticker you were charting when you look at your saved layouts list, but they are in no way related to those tickers.
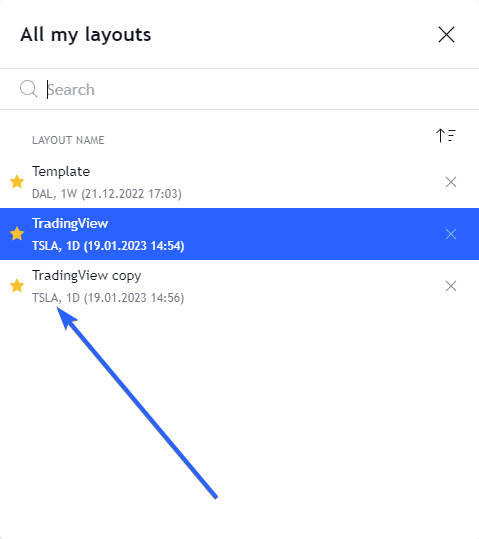
A layout doesn't care if you name it after a ticker and therefore think you associated it with that ticker now, no, it's just a mindless folder full of docs. When you create a new folder on your PC and name it "Love Poems" you don't expect to smell a cheap perfume and see withered rose petals when you open that folder from now on. So layout names are basically those titles or folder names that the folder itself is not aware of.
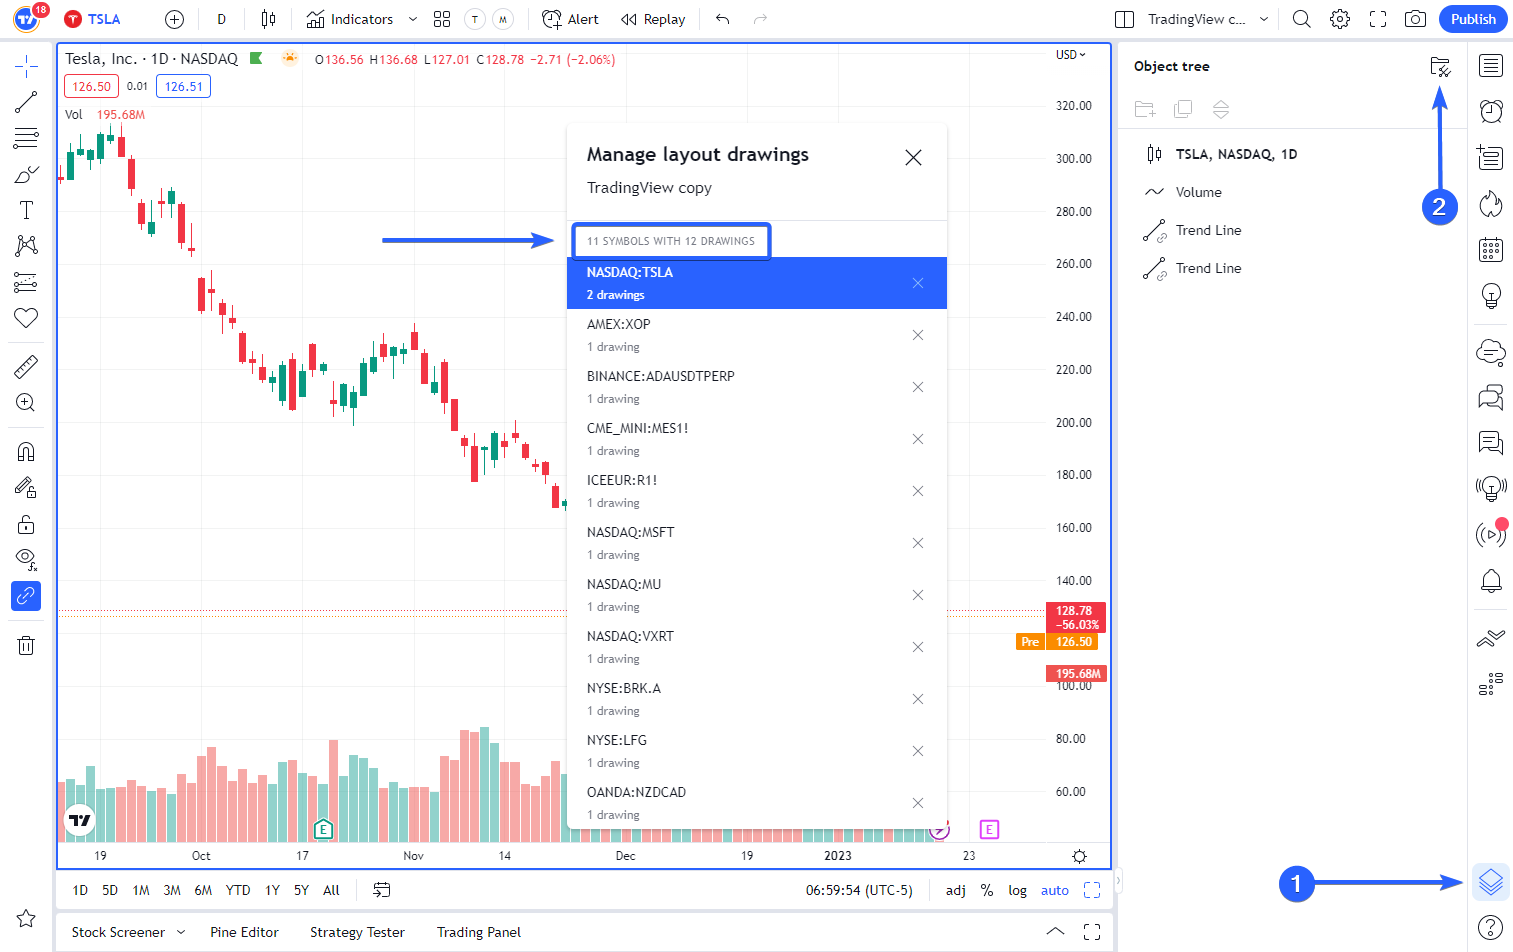
So, layout saves every symbol/chart you work on within itself (if you have autosave on or save the chart manually, that is). In fact, you can see all your saved symbol charts within a chart layout in the drawings manager found in the object tree:
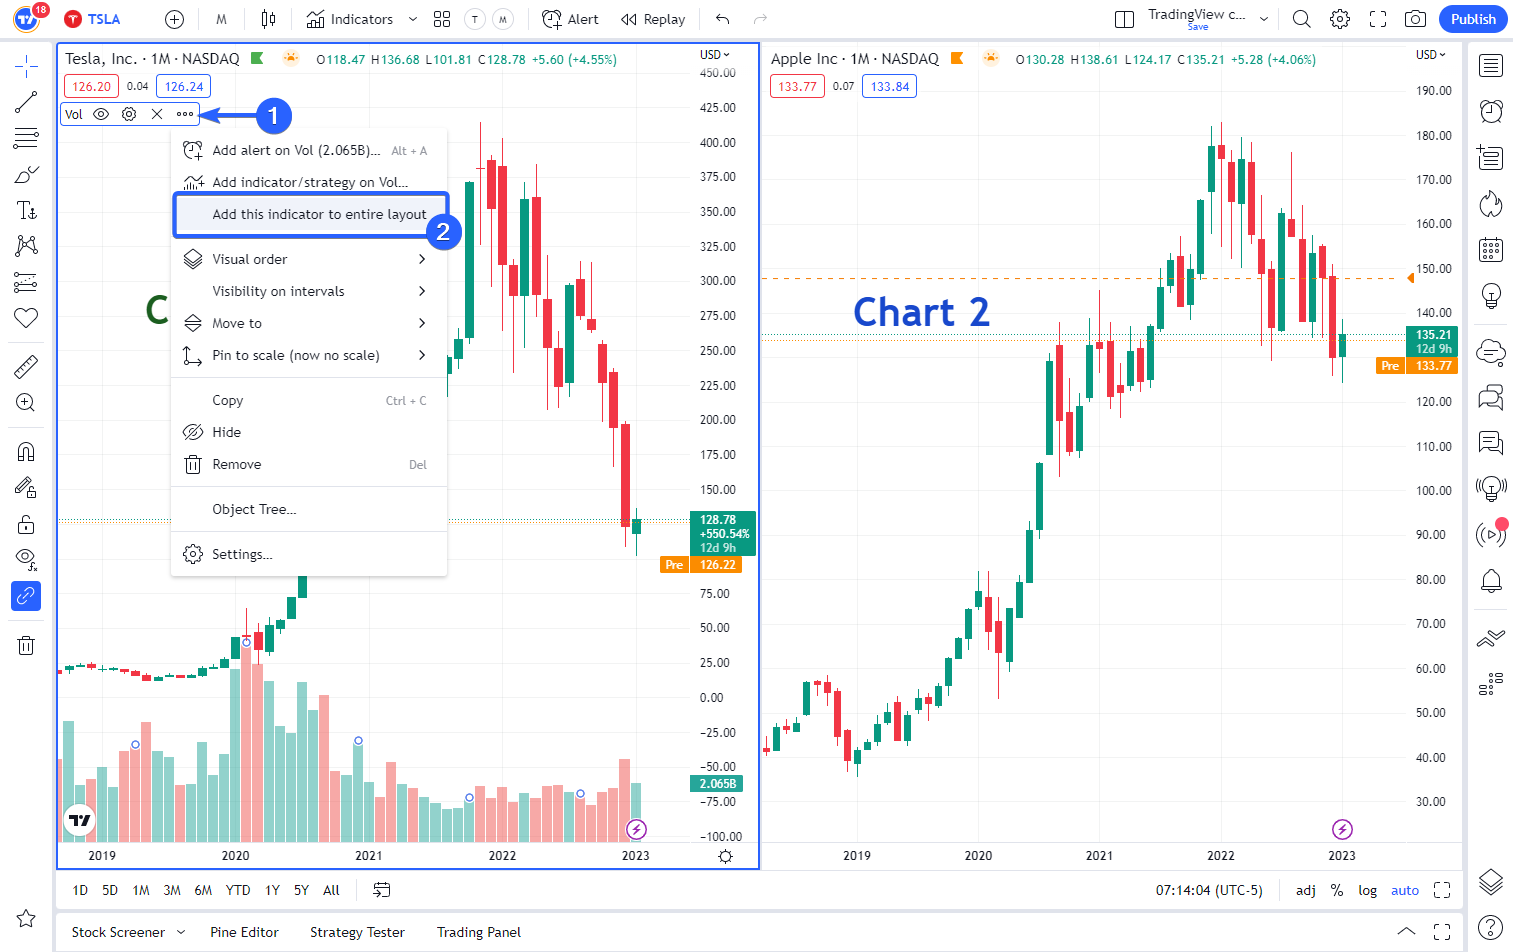
Now, having come to this point, let's talk about the multi-chart layouts I previously mentioned. So when you have a single chart open that's just chart 1.

When you have, say, 4 charts open - those will be charts 1 to 4, in this order:
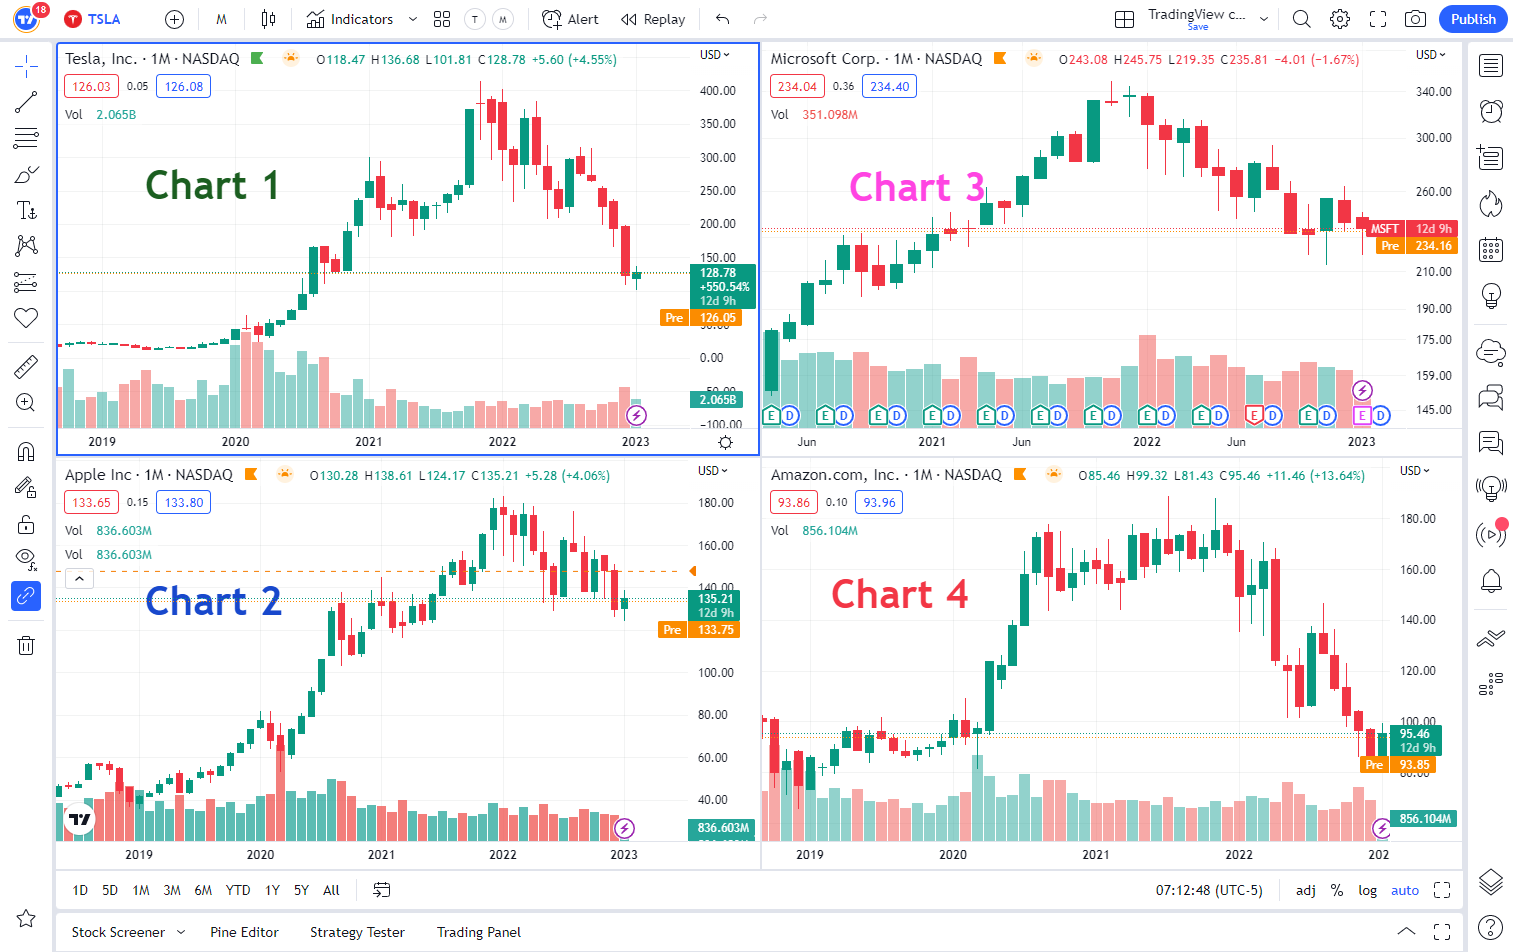
That's 4 chart windows, ok? And if we go on with our folder analogy from before, where layouts are folders and saved within it symbol/ticker charts are documents, then these 4 chart windows would be sub-folders.
What can be quite confusing here is that all the changes that you ever make to a specific chart of a multi-chart layout are saved within this particular chart window (sub-folder), not necessarily all other chart windows, meaning different chart windows within one layout work like separately saved sub-folders that can have different sets of drawings, indicators and even chart settings.
This really helps people that could lose their multi charts when swapping back to single chart view (like for example when they want to have 4 charts side by side, all with different analysis).
What can bring even more confusion to the table though is trying to sync all these chart windows. Indicators are easy, for indicators you can just do this:

Syncing drawings on the other hand is like enabling a mode - you activate it, you open a multi-chart layout, open the same ticker in those charts, now newly created drawings will start syncing between those charts within a layout. You miss any of these steps the syncing may go sideways. And syncing doesn't work retrospectively, so if you go to a single chart layout and work just there for some time, then when you open a multi-chart view those charts are being restored from before, they are not just being cloned from the current version of your single chart.
What you can do here if you need to go back to single chart view is not actually going back to a 1-chart layout

but maximizing one of the chart windows instead (bottom right corner of the chart page)

This way the drawings will keep syncing.
That's all for now folks.
If you want to tell us what you find most confusing or just simply dislike about the current layout system please let us know via support tickets.