Trend Line
Application
The Trend Line drawing tool has several useful applications. It is predominantly used to manually draw lines illustrating trends in the market or associated indicators. It can also be used as arrows (there is an option to put an arrow on one or both ends) which are used to designate points of interest. To draw a trend line at 45-degree angle, keep the Shift key pressed while drawing.
Style
In Style property dialog it is possible to change the appearance of a Trend Line:
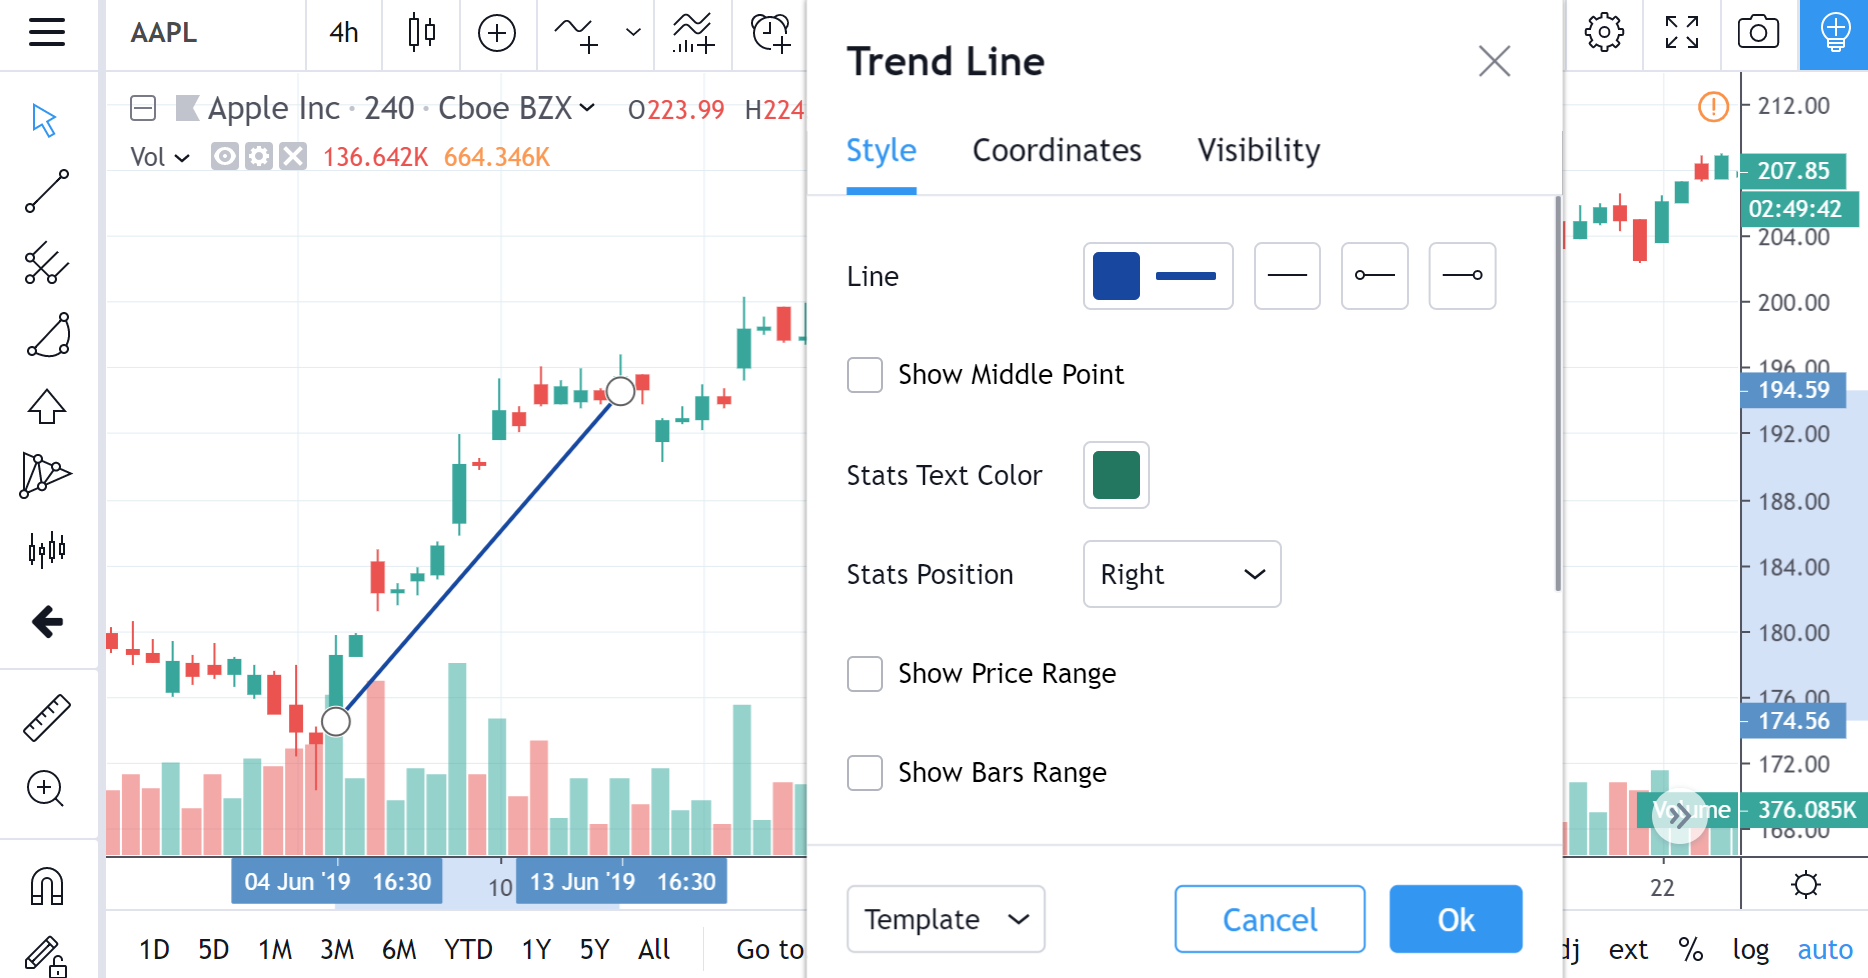
Line
Sets the color, opacity, thickness and style of a trend line. The second drop-down menu contains options of setting the line style and extending one or both line's ends to infinity. Also, in the last two drop-downs of Line, an arrow-shaped end may be set instead of a normal one for the left and right ends of the line.

Show Middle Point
Toggles the visibility of the trend line's mid-point.
Text
Checkboxes Show Price Range, Bars Range, Date/Time Range, Show Distance, Show Angle allow to display the text with the relevant information beside the Trend Line on a chart. Stats Text Color drop-down menu allows to change the color, font type and font size for this text. Position for this text is to be selected in Stats Position drop-down menu.
Show Price Range
Toggles the visibility of text displaying the price range (absolute, percent values and ticks) between the trend line's two points.
Show Bars Range
Toggles the visibility of text displaying the number of bars between the trend line's two points.
Show Date/Time Range
Toggles the visibility of text displaying the date/time range between the trend line's two points.
Show Distance
Toggles the visibility of text displaying the specific distance (in terms of periods) between the trend line's two points.
Show Angle
Toggles the visibility of text displaying the inclination angle of a trend line (in degrees).
Always Show Stats
If this checkbox is not selected, Stats Text will appear beside only when the Trend Line is selected by mouse click.
Coordinates
In Coordinates properties dialog you can set precisely the position of the Trend Line's end points on the price scale (by setting the price) and the time scale (by setting the bar number):

Price 1
Allows for the precise placement of the trend line's first point (Price 1) using a bar number and price.
Price 2
Allows for the precise placement of the trend line's second point (Price 2) using a bar number and price.
Visibility
In visibility properties dialog you can switch displaying of a Trend Line on charts of different timeframes:

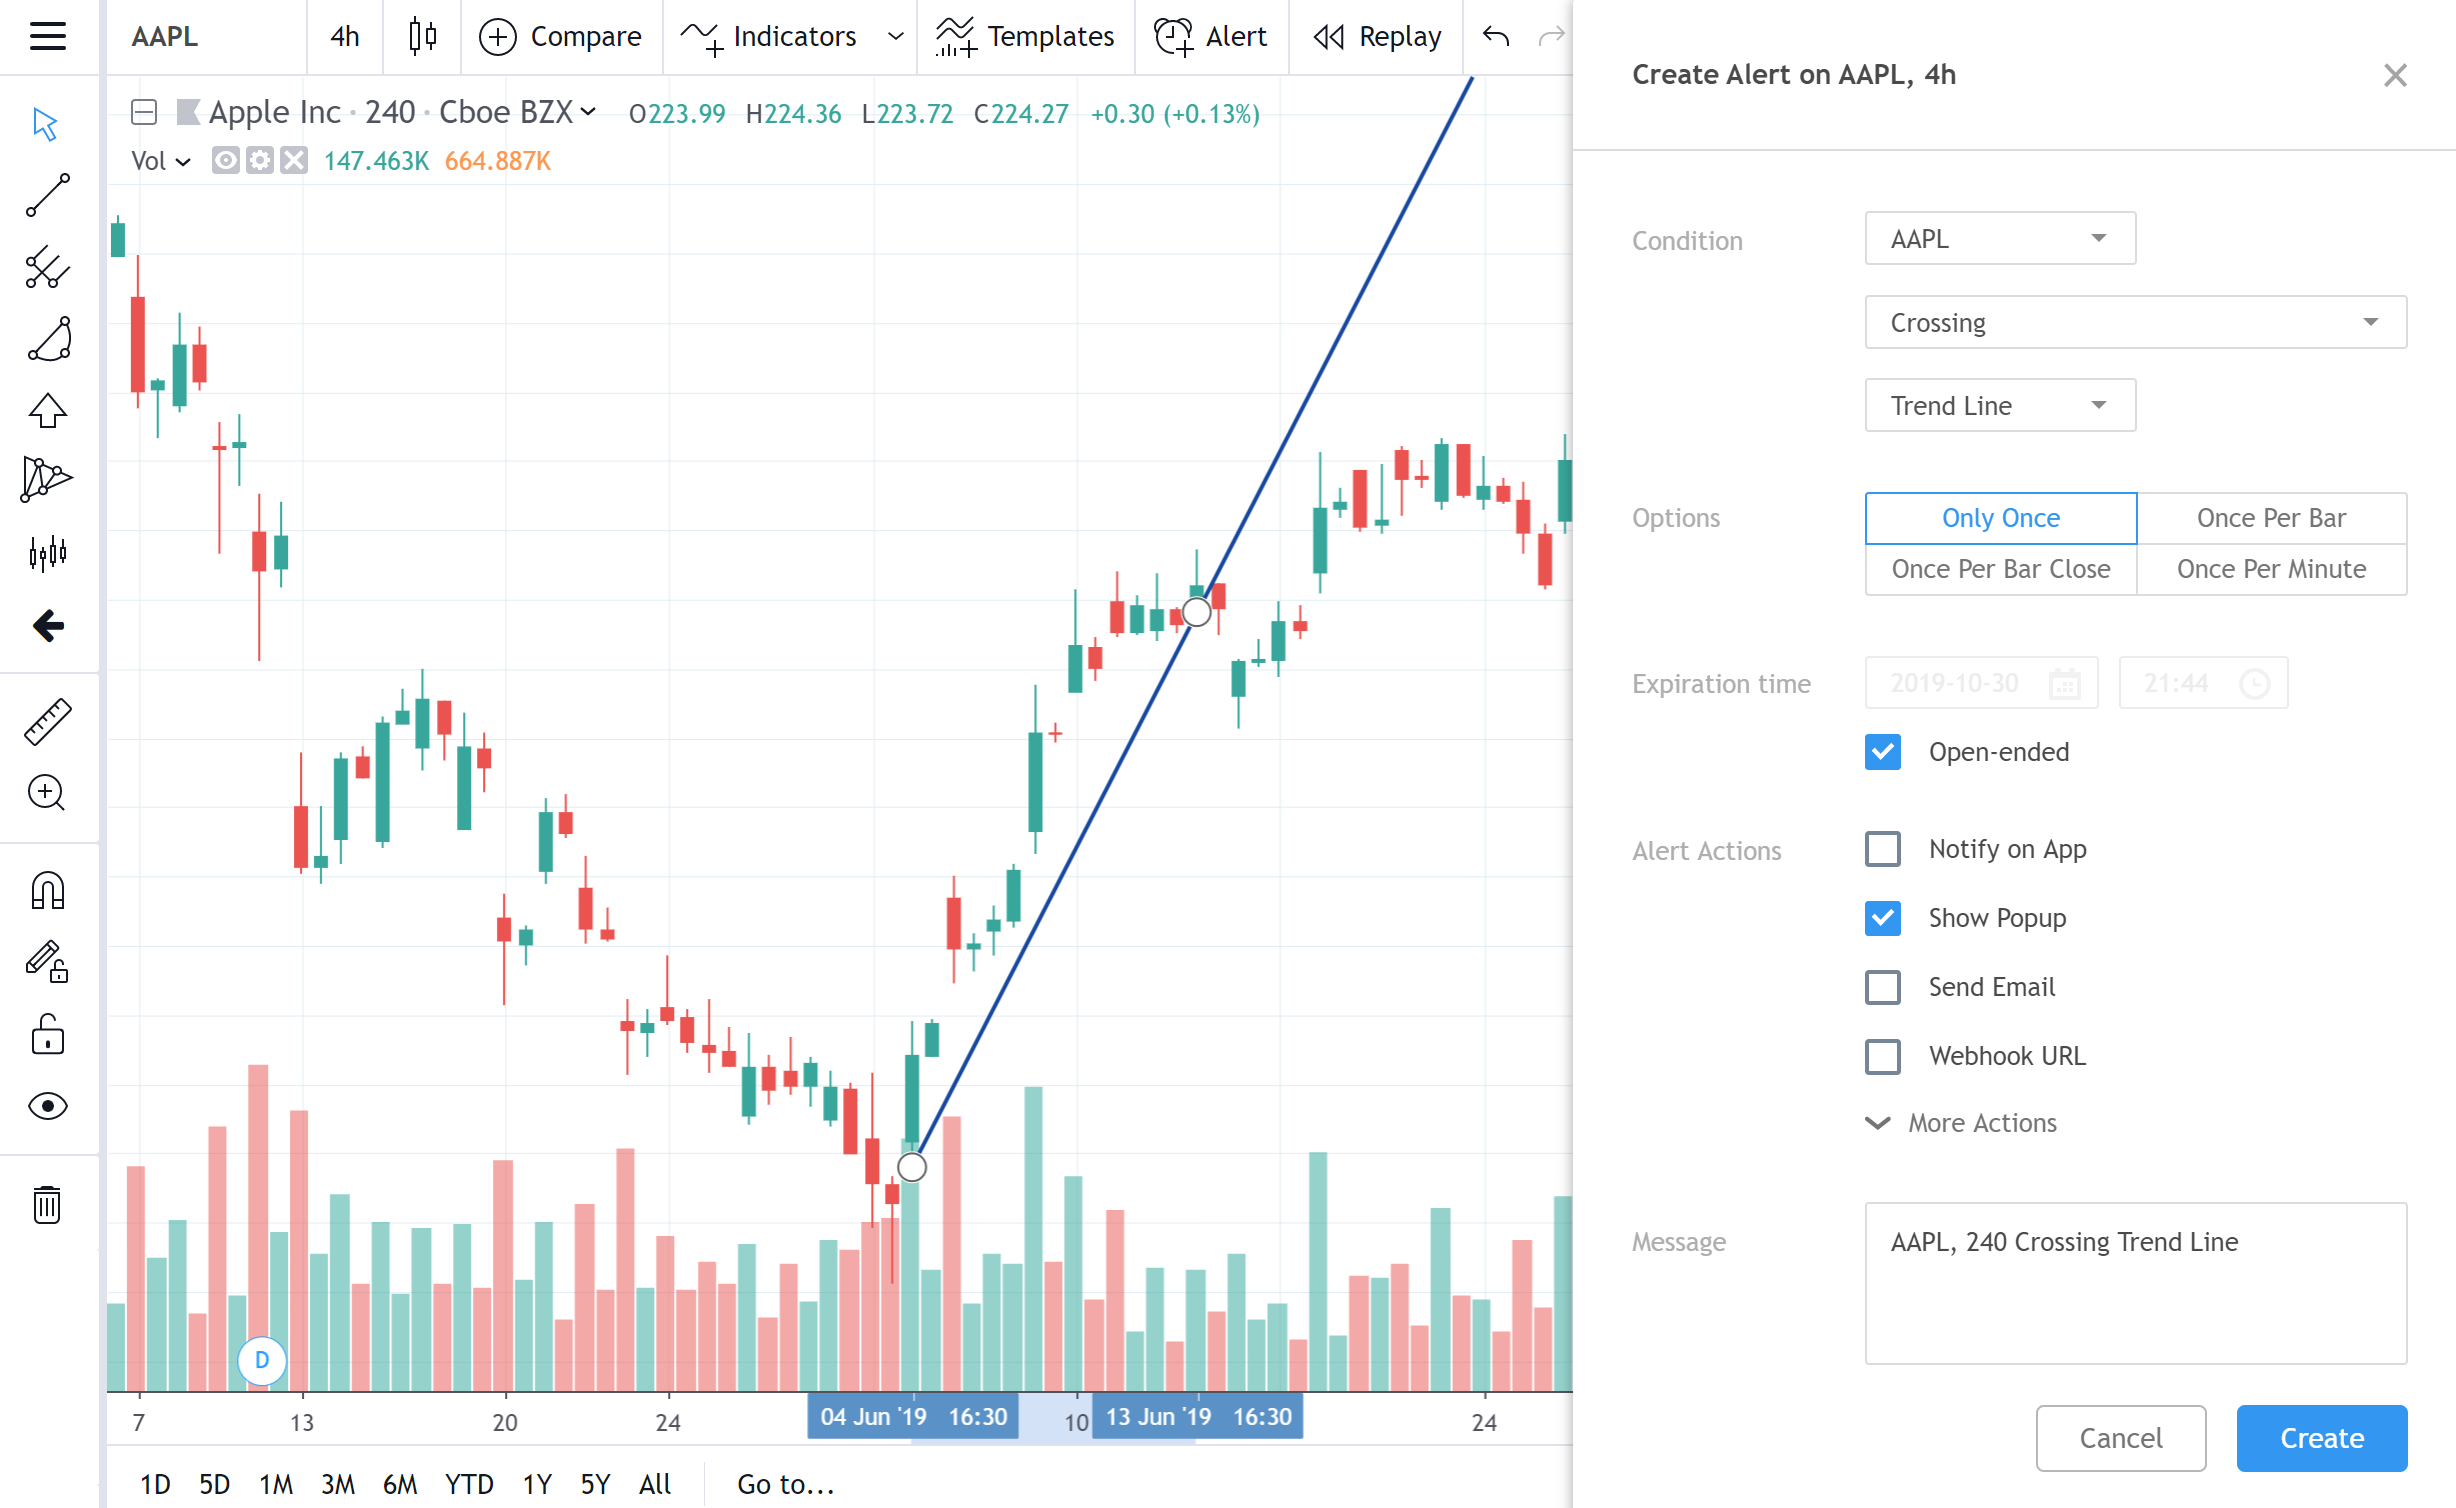
Alert
It is possible to set an alert to get notified about a series crossed the Trend Line on a chart. Use the clock icon in floating drawing toolbar or in right click menu on the Trend Line itself:

Then select a condition, periodicity and preferable method of notification and press Create: