Seasonal Momentum Indicator This is basically a 5-period seasonal average with an applied momentum (10 ) applied. This is plotted and compared to the current momentum (10). The current momentum is in red while the seasonal momentum is in blue.
You can see that whenever the seasonal momentum and the current momentum are in the same direction, the probability of the trend continuing is higher. Also whenever there is a divergence in the two; the red line (current momentum) will often catch up to the blue (seasonal momentum).
Another use of this indicator is as a divergence detector. If you turn off the red line, you will have only the blue line plotted on the graph. Take this and apply lines to see if the momentum diverges from the price (see example).
I hope you enjoy this one. It only works for securities which have a five year record. You can use it on different time frames but the annual is probably the best and most useful.
Happy Trading
--SpreadEagle71
ค้นหาในสคริปต์สำหรับ "momentum"

Relative Momentum Index Strategy The Relative Momentum Index (RMI) was developed by Roger Altman. Impressed
with the Relative Strength Index's sensitivity to the number of look-back
periods, yet frustrated with it's inconsistent oscillation between defined
overbought and oversold levels, Mr. Altman added a momentum component to the RSI.
As mentioned, the RMI is a variation of the RSI indicator. Instead of counting
up and down days from close to close as the RSI does, the RMI counts up and down
days from the close relative to the close x-days ago where x is not necessarily
1 as required by the RSI). So as the name of the indicator reflects, "momentum" is
substituted for "strength".
WARNING:
- This script to change bars colors.

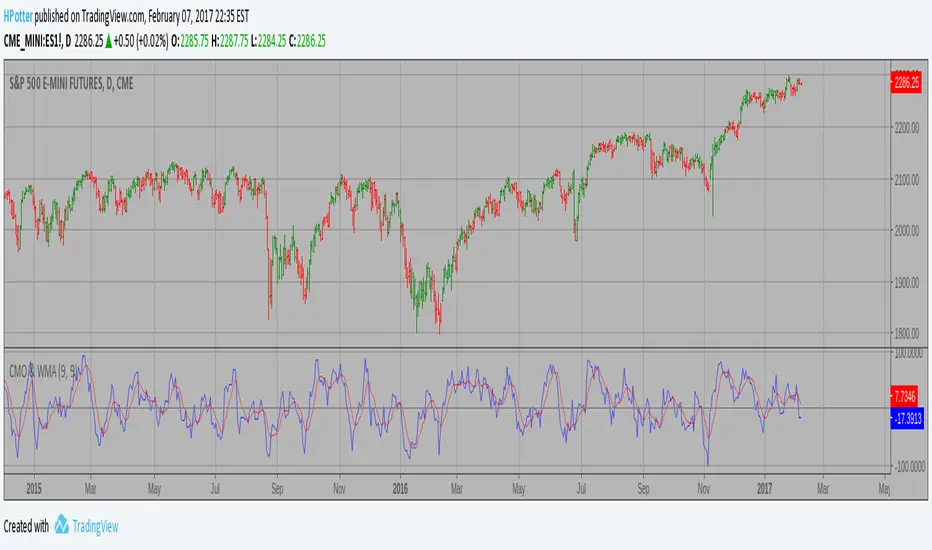
CMO & WMA Strategy This indicator plots Chande Momentum Oscillator and its WMA on the
same chart. This indicator plots the absolute value of CMO.
The CMO is closely related to, yet unique from, other momentum oriented
indicators such as Relative Strength Index, Stochastic, Rate-of-Change,
etc. It is most closely related to Welles Wilder?s RSI, yet it differs
in several ways:
- It uses data for both up days and down days in the numerator, thereby
directly measuring momentum;
- The calculations are applied on unsmoothed data. Therefore, short-term
extreme movements in price are not hidden. Once calculated, smoothing
can be applied to the CMO, if desired;
- The scale is bounded between +100 and -100, thereby allowing you to clearly
see changes in net momentum using the 0 level. The bounded scale also allows
you to conveniently compare values across different securities.
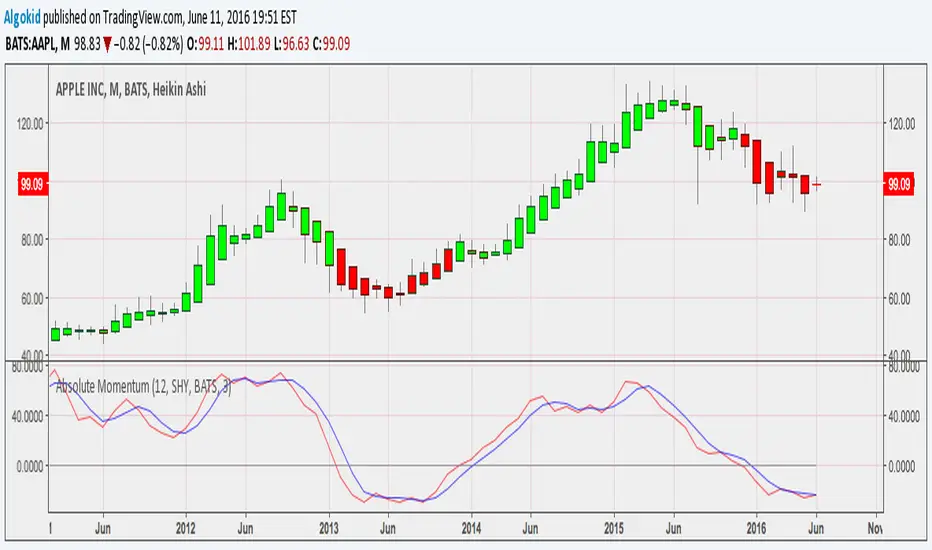
Absolute Momentum Indicator Covered intensevely by Gary Antonnacci in his paper " Absolute Momentum : A simple Rule Based Strategy and Universal Trend Following Overlay , Absolute momentum buys asset with excess return, which is calculated by taking the return of the asset for a giving period of time LESS the Treasury bill rate . The following indicator is based on the rules found in the paper. However you have the liberty to choose your time frame and symbol to calculate the excess return .
Read more about this indicator here
Cheers
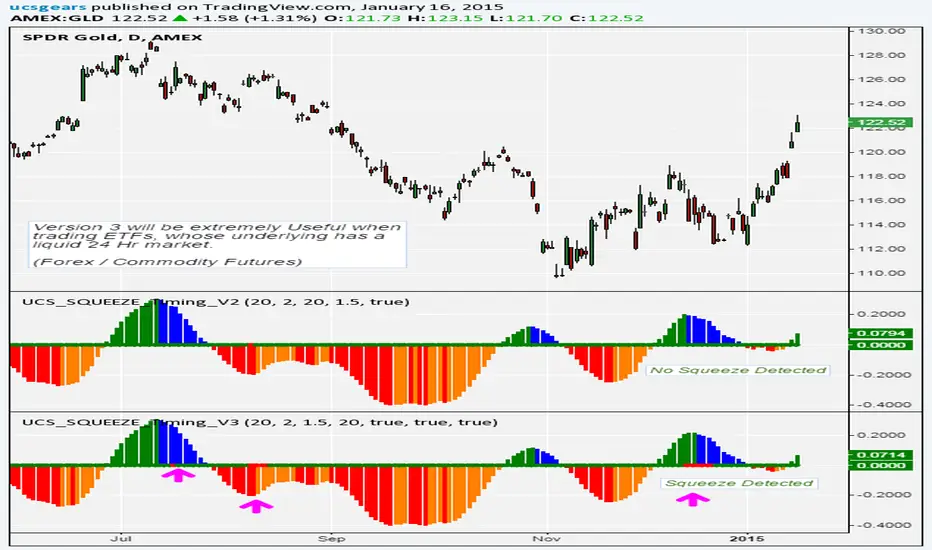
UCS_Squeeze_Timing-V3Another Version with More Features . I am confident enough this works fine now. I am Sure this will be a valuable tool for you guys who love squeezes.
///////////////// This can be further optimized, Let me know with a comment, if you still need this to be optimized. ////////////////////
This update includes
- Added Options to detect squeeze using Heikin Ashi Candle
- Added Options to use BBR or Momentum (ROC) for the Momentum Histogram
- Custom Momentum Smoothing time period
- Removed the Separate Look back periods for BB/KC - Since it doesn't really make sense using different lengths for KC and BB.
HA Closes can be really helpful in trading ETFs like FXE, GLD, FXY, SLV etc, which constantly gaps on daily basis. This helps in smoothing out. And most Importantly it Lines up with the Underlying's Squeeze.
[The Next Major Version is currently being Back tested with better timing triggers etc...... That will replace all other Squeeze indicators in the market - Some Major upgrades have been done to the squeezes to read the consolidation is with support or resistance. Also plan on adding best bet entries and pre-breakout signals. So far so good, this recent contradicting trends in daily / weekly in the market is making the indicator hard to work per theory]
The delay is because, I do not like to post any script (with signals) without sufficient back testing . I will not post these indicator with signals, unless I am sure it works per my theoretical derivations.
-
Thanks for Being Patient and all your support.
Until then - Good Luck Trading.
Squeeze Momentum Indicator [LazyBear]
Fixed a typo in the code where BB multiplier was stuck at 1.5. Thanks @ucsgears for bringing it to my notice.
Updated source: pastebin.com
Use the updated source instead of the what TV shows below.
This is a derivative of John Carter's "TTM Squeeze" volatility indicator, as discussed in his book "Mastering the Trade" (chapter 11).
Black crosses on the midline show that the market just entered a squeeze (Bollinger Bands are with in Keltner Channel). This signifies low volatility, market preparing itself for an explosive move (up or down). Gray crosses signify "Squeeze release".
Mr.Carter suggests waiting till the first gray after a black cross, and taking a position in the direction of the momentum (for ex., if momentum value is above zero, go long). Exit the position when the momentum changes (increase or decrease --- signified by a color change). My (limited) experience with this shows, an additional indicator like ADX / WaveTrend, is needed to not miss good entry points. Also, Mr.Carter uses simple momentum indicator, while I have used a different method (linreg based) to plot the histogram.
More info:
- Book: Mastering The Trade by John F Carter
List of all my indicators:

CMO (Chande Momentum Oscillator)Hi
Let me introduce my CMO (Chande Momentum Oscillator) script.
This indicator plots Chandre Momentum Oscillator. This indicator was
developed by Tushar Chande. A scientist, an inventor, and a respected
trading system developer, Mr. Chande developed the CMO to capture what
he calls "pure momentum". For more definitive information on the CMO and
other indicators we recommend the book The New Technical Trader by Tushar
Chande and Stanley Kroll.
The CMO is closely related to, yet unique from, other momentum oriented
indicators such as Relative Strength Index, Stochastic, Rate-of-Change,
etc. It is most closely related to Welles Wilder`s RSI, yet it differs
in several ways:
- It uses data for both up days and down days in the numerator, thereby
directly measuring momentum;
- The calculations are applied on unsmoothed data. Therefore, short-term
extreme movements in price are not hidden. Once calculated, smoothing
can be applied to the CMO, if desired;
- The scale is bounded between +100 and -100, thereby allowing you to
clearly see changes in net momentum using the 0 level. The bounded scale
also allows you to conveniently compare values across different securities.

Stop Hunt / Liquidity Sweep Detector with Momentum Ratingdetects liquidity sweeps as they happen then gives you a rating on how much momentum the reversal has.

Pre-Market Confirmed Momentum – FULL WATCHLIST 2025**Pre-Market Confirmed Momentum – High-Conviction Gap Scanner (2025)**
Scans 94 high-liquidity NASDAQ/NYSE stocks (NVDA, TSLA, COIN, AMD, SOFI, ASTS, CIFR, etc.) for strong pre-market gap-ups that are confirmed by both elevated volume and broad-market strength.
**Entry triggers only when ALL are true at 09:29 ET:**
- ≥ +1.5% gap from previous regular close
- Pre-market volume ≥ 2.5× the 20-day average
- QQQ pre-market ≥ +0.5% (market filter)
Back-tested June 2024 – Dec 2025:
68 signals → **+1.96% average intraday return** → **75% win rate** after 1.5% hard stop.
Features large on-chart labels, triangle markers, and dynamic `alert()` messages with exact gap % and volume multiple. Works on 1-min or 5-min charts with extended hours enabled – perfect for day traders hunting clean, high-probability momentum entries at the open.
Ready for watchlist scanning and real-time alerts. Enjoy the edge! 🚀

Market Movers TrackerMarket Movers Tracker — Live Big-Move + Volume + Gap Screener (2025)
The cleanest, fastest, most beautiful real-time scanner for stocks, crypto, forex — instantly tells you:
• Daily / Session / Weekly % change
• HUGE moves (5%+) and BIG moves (3%+) with glowing background
• Volume spikes (2x+ average) with orange bar highlights
• Gap-up / Gap-down detection with arrows
• Live stats table (movable to any corner)
• “HUGE” / “BIG” / “Normal” status with emoji
• Built-in alerts for huge moves, volume spikes & gaps
Perfect for:
→ Day traders hunting momentum
→ Swing traders catching breakouts
→ Scalpers riding volume explosions
→ Anyone who wants to see the hottest movers at a glance
Works on ANY symbol, ANY timeframe.
Zero lag. Zero repainting. Pure price + volume truth.
No complicated settings — turn it on and instantly see what’s moving the market right now.
Not financial advice. Just the sharpest scanner on TradingView.
Made with love for the degens, apes, and momentum chads & volume junkies.

Morning Momentum//@version=5
indicator("Morning Momentum", overlay=true) // This is your one required declaration
// --- Define Time Window ---
startTime = timestamp("2025-11-28T09:30:00")
endTime = timestamp("2025-11-28T10:00:00")
inWindow = time >= startTime and time <= endTime
// --- Define Price Change ---
priceChange = (close - open) / open * 100
// --- Define Volume Spike ---
volumeSMA = ta.sma(volume, 20)
volumeSpike = volume > volumeSMA
// --- Trigger Condition ---
signal = inWindow and priceChange > 2 and volumeSpike
// --- Plot Signal ---
plotshape(signal, title="Momentum Signal", location=location.abovebar, color=color.green, style=shape.triangleup)

Futures Momentum Scanner – jyoti//@version=5
indicator("Futures Momentum Scanner – Avvu Edition", overlay=false, max_lines_count=500)
//------------------------------
// USER INPUTS
//------------------------------
rsiLen = input.int(14, "RSI Length")
macdFast = input.int(12, "MACD Fast")
macdSlow = input.int(26, "MACD Slow")
macdSignal = input.int(9, "MACD Signal")
stLength = input.int(10, "Supertrend Length")
stMult = input.float(3.0, "Supertrend Multiplier")
//------------------------------
// SUPER TREND
//------------------------------
= ta.supertrend(stMult, stLength)
trendUp = stDirection == 1
//------------------------------
// RSI
//------------------------------
rsi = ta.rsi(close, rsiLen)
rsiBull = rsi > 50 and rsi < 65
//------------------------------
// MACD
//------------------------------
= ta.macd(close, macdFast, macdSlow, macdSignal)
macdBull = macd > signal and macd > 0
//------------------------------
// MOVING AVERAGE TREND
//------------------------------
ema20 = ta.ema(close, 20)
ema50 = ta.ema(close, 50)
ema200 = ta.ema(close, 200)
trendStack = ema20 > ema50 and ema50 > ema200
//------------------------------
// BREAKOUT LOGIC
//------------------------------
prevHigh = ta.highest(high, 20)
breakout = close > prevHigh
//------------------------------
// FINAL SCANNER LOGIC
//------------------------------
bullishCandidate = trendUp and rsiBull and macdBull and trendStack and breakout
//------------------------------
// TABLE OUTPUT FOR SCANNER FEEL
//------------------------------
var table t = table.new(position.top_right, 1, 1)
if barstate.islast
msg = bullishCandidate ? "✔ BUY Candidate" : "– Not a Setup"
table.cell(t, 0, 0, msg, bgcolor=bullishCandidate ? color.new(color.green, 0) : color.new(color.red, 70))
//------------------------------
// ALERT
//------------------------------
alertcondition(bullishCandidate, title="Scanner Trigger", message="This stock meets Avvu's futures scanner criteria!")

Volatility Signal-to-Noise Ratio🙏🏻 this is VSNR: the most effective and simple volatility regime detector & automatic volatility threshold scaler that somehow no1 ever talks about.
This is simply an inverse of the coefficient of variation of absolute returns, but properly constructed taking into account temporal information, and made online via recursive math with algocomplexity O(1) both in expanding and moving windows modes.
How do the available alternatives differ (while some’re just worse)?
Mainstream quant stat tests like Durbin-Watson, Dickey-Fuller etc: default implementations are ALL not time aware. They measure different kinds of regime, which is less (if at all) relevant for actual trading context. Mix of different math, high algocomplexity.
The closest one is MMI by financialhacker, but his approach is also not time aware, and has a higher algocomplexity anyways. Best alternative to mine, but pls modify it to use a time-weighted median.
Fractal dimension & its derivatives by John Ehlers: again not time aware, very low info gain, relies on bar sizes (high and lows), which don’t always exist unlike changes between datapoints. But it’s a geometric tool in essence, so this is fundamental. Let it watch your back if you already use it.
Hurst exponent: much higher algocomplexity, mix of parametric and non-parametric math inside. An invention, not a math entity. Again, not time aware. Also measures different kinds of regime.
How to set it up:
Given my other tools, I choose length so that it will match the amount of data that your trading method or study uses multiplied by ~ 4-5. E.g if you use some kind of bands to trade volatility and you calculate them over moving window 64, put VSNR on 256.
However it depends mathematically on many things, so for your methods you may instead need multipliers of 1 or ~ 16.
Additionally if you wanna use all data to estimate SNR, put 0 into length input.
How to use for regime detection:
First we define:
MR bias: mean reversion bias meaning volatility shorts would work better, fading levels would work better
Momo bias: momentum bias meaning volatility longs would work better, trading breakouts of levels would work better.
The study plots 3 horizontal thresholds for VSNR, just check its location:
Above upper level: significant Momo bias
Above 1 : Momo bias
Below 1 : MR bias
Below lower level: significant MR bias
Take a look at the screenshots, 2 completely different volatility regimes are spotted by VSNR, while an ADF does not show different regime:
^^ CBOT:ZN1!
^^ INDEX:BTCUSD
How to use as automatic volatility threshold scaler
Copy the code from the script, and use VSNR as a multiplier for your volatility threshold.
E.g you use a regression channel and fade/push upper and lower thresholds which are RMSEs multiples. Inside the code, multiply RMSE by VSNR, now you’re adaptive.
^^ The same logic as when MM bots widen spreads with vola goes wild.
How it works:
Returns follow Laplace distro -> logically abs returns follow exponential distro , cuz laplace = double exponential.
Exponential distro has a natural coefficient of variation = 1 -> signal to noise ratio defined as mean/stdev = 1 as well. The same can be said for Student t distro with parameter v = 4. So 1 is our main threshold.
We can add additional thresholds by discovering SNRs of Student t with v = 3 and v = 5 (+- 1 from baseline v = 4). These have lighter & heavier tails each favoring mean reversion or momentum more. I computed the SNR values you see in the code with mpmath python module, with precision 256 decimals, so you can trust it I put it on my momma.
Then I use exponential smoothing with properly defined alphas (one matches cumulative WMA and another minimizes error with WMA in moving window mode) to estimate SNR of abs returns.
…
Lightweight huh?
∞

Stochastic Pro+ Suite📚 What Is the Stochastic Oscillator?
The stochastic oscillator is a momentum indicator comparing a security's closing price to its price range over a set number of periods. The %K line represents the raw stochastic value, while the %D line is a smoothed moving average of %K.
Stochastic helps identify:
Overbought and oversold conditions
Bullish and bearish crossovers
Momentum shifts before price reversals
It is widely used in both trending and ranging markets.
💡 What Makes This Suite Different?
This script supercharges the traditional stochastic with a multi-timeframe engine , divergence detection , and a highly customizable visual suite , including:
✅ Core Features:
- Multi-Timeframe (%K, %D, Spread): Pulls stochastic data from any higher timeframe for improved signal quality.
- Custom Overbought/Oversold Levels: Fully adjustable OB/OS thresholds (default: 80/20).
- %K-%D Spread Histogram: View the difference between %K and %D visually as a histogram.
- Color-coded Cross Highlights: Optional background shading for key crossover events in OB/OS zones (high probability reversal areas).
🔍 Divergence Detection (Optional):
- Bullish Divergence: Price makes lower lows while %K makes higher lows.
- Bearish Divergence: Price makes higher highs while %K makes lower highs.
- Customizable pivot lookbacks and range filters to control divergence strictness.
- Visual divergence labels plotted directly on the oscillator.
🎛️ Fully Toggleable Visuals:
Show/hide %K, %D, OB/OS lines, spread histogram, background highlight, and divergence — all via simple checkboxes.
🔔 Alerts:
Set alerts for both bullish and bearish divergences — ideal for swing, day, or trend reversal strategies.
⚙️ Use Cases
- Spot exhaustion in overbought/oversold zones
- Confirm or filter entries with divergence signals
- Monitor multiple timeframes without switching charts
- Use as a signal tool in confluence with price action or volume indicators
⚠️ Disclaimer
This tool is for educational and informational purposes only. It does not constitute financial advice, trading advice, or investment guidance. Always do your own research and consult a qualified financial advisor before making trading decisions.

MACD Trend & Momentum Dashboard (Weighted, 3 TFs)This indicator provides a multi-timeframe MACD trend and momentum dashboard that works independently of your current chart timeframe. It displays MACD zero-line bias and MACD-vs-Signal trend state across three user-selectable timeframes, using clear color-coded cells for instant visual interpretation. A weighted scoring system combines all six signals into a single market bias classification (Strong Bullish → Strong Bearish). This helps traders quickly understand higher- and lower-timeframe alignment, market regime, and overall trend quality. Ideal for trend- and momentum-followers who want a clean, actionable market overview at a glance.

XAUUSD Fisher Transform Dashboard — Trend & Momentum InsightsThe script offers an educational visualization of trend and momentum on XAUUSD by combining the Fisher Transform with EMA direction. It plots momentum shifts, trend alignment, and includes a concise dashboard showing trend bias, the latest crossover event, and customizable percentage-based reference markers.
This tool is for market analysis and study purposes only and does not provide trading advice.

Nifty Futures Momentum ScalperNifty Futures Momentum Scalper
Backtesting
VPA , RSI, momentum trades with EMA crossover

⚡ Elite Momentum Pro🎯 Key Features
1. Smart Signal Engine
3 Signal Modes: Aggressive, Balanced, Conservative
7-Point Scoring System - Ensures high-quality signals
Anti-Flip Protection - Prevents rapid signal changes
Multiple confirmations: Supertrend, MACD, RSI, EMA alignment, momentum
2. Advanced Risk Management
3 Take Profit Levels (TP1, TP2, TP3) for scaling out
ATR-Based Dynamic Stops - Adapts to volatility
Customizable Risk:Reward (default 2.5:1)
Visual stop and target levels
3. Clean Visual Design
Color-coded price bars based on trend strength
EMA Ribbon (9, 21, 50, 200) for trend clarity

Options Momentum SignalCustomizable Intraday Options Scalping Alert.
Several important, complementary indicators combined into one simple signal that pops up under a bar to indicate sustained momentum on a trend. It uses a combination of calculations based on the 1m VWAP, price increase in contrast to previous day's close, and customizable Volatility and Volume Data.
It has adjustable values for the % increase from last close (labeled as Pre-Mkt % Threshold), minimal candle body % to filter out weaker signals, RVOL threshold, minimum CVD (it's rolling, so functions in tandem with the CVD lookback value for the number of bars.)
It offers individual boxes that can be checked on or off to help filter out noise. Boxes are: Use 1m VWAP, Use CVD, 3-bar cooldown (reduces back-to-back signals, especially on shorter (1m, 2m, and 5m) charts), VWAP bounce option to catch bounces happening in real time before the candle closes, Use RVOL, and Use Rolling CVD. These can all be checked on or off and will create vastly different signals depending on what you are filtering for.
These indicators were chosen specifically as I feel they help most with option scalping and is intended to be used alongside a few other indicators for confirmation. Personally, I use a couple anchored VWAPs (highest high, session) as well as a FRAMA channel for confirmation. I also use the following to further confirm trends: TradingView’s RVOL, CVD, and Price Pattern Oscillators, in addition to Beardy Fred's TTM Squeeze Pro.
Hope this helps some people!

Crypto Early Momentum — Screener v6 (robust)Screens Crypto Pairs for momentum and assigns a momentum score.

Opening ATR + High Momentum (10/30/60)this is a custom momentum indicator using atr
A fixed, compiling Pine v5 script is below with the three issues corrected: no plots in local scope, a ≤10-character shorttitle, and cleaned ternaries/formatting that remove the “end of line without line continuation” error.
HeatCandleHeatCandle - AOC Indicator
✨ Features
📊 Heat-Map Candles: Colors candles based on the price’s deviation from a Triangular Moving Average (TMA), creating a heat-map effect to visualize price zones.
📏 Zone-Based Coloring: Assigns colors to 20 distinct zones (Z0 to Z19) based on the percentage distance from the TMA, with customizable thresholds.
⚙️ Timeframe-Specific Zones: Tailored zone thresholds for 1-minute, 5-minute, 15-minute, 30-minute, 1-hour, and 4-hour timeframes for precise analysis.
🎨 Customizable Visuals: Gradient color scheme from deep blue (oversold) to red (overbought) for intuitive price movement interpretation.
🛠️ Adjustable Parameters: Configure TMA length and threshold multiplier to fine-tune sensitivity.
🛠️ How to Use
Add to Chart: Apply the "HeatCandle - AOC" indicator on TradingView.
Configure Inputs:
TMA Length: Set the period for the Triangular Moving Average (default: 150).
Threshold Multiplier: Adjust the multiplier to scale zone sensitivity (default: 1.0).
Analyze: Observe colored candles on the chart, where colors indicate the price’s deviation from the TMA:
Dark blue (Z0) indicates strong oversold conditions.
Red (Z19) signals strong overbought conditions.
Track Trends: Use the color zones to identify potential reversals, breakouts, or trend strength based on price distance from the TMA.
🎯 Why Use It?
Visual Clarity: The heat-map candle coloring simplifies identifying overbought/oversold conditions at a glance.
Timeframe Flexibility: Zone thresholds adapt to the selected timeframe, ensuring relevance across short and long-term trading.
Customizable Sensitivity: Adjust TMA length and multiplier to match your trading style or market conditions.
Versatile Analysis: Ideal for scalping, swing trading, or trend analysis when combined with other indicators.
📝 Notes
Ensure sufficient historical data for accurate TMA calculations, especially with longer lengths.
The indicator is most effective on volatile markets where price deviations are significant.
Pair with momentum indicators (e.g., RSI, MACD) or support/resistance levels for enhanced trading strategies.
Happy trading! 🚀📈
