RedK DualTF Volume-Accelerated CCI (RedK VA-CCI)🟩 RedK VA-CCI Release Notes
===========================
RedK VA-CCI is a modern take on the Commodity Channel Index (CCI) classic indicator.
RedK VA-CCI leverages the core CCI concept, and builds around it to provide traders with comprehensive insights, dual timeframe capabilities, and many other valuable features.
█ Background
=============
The Commodity Channel Index (CCI) is a favorite indicator for many traders. Donald Lambert introduced the CCI in 1980, in what was then Commodities maga
Redk
RedK Indicator Amplifier (RedK i-Amp)🟩 What is RedK i-Amp?
-------------------------------
RedK i-Amp is not an indicator in itself - it's a "wrapper" utility that "amplifies" another "source" indicator by improving its visual and alerting capabilities.
RedK i-Amp hooks to another indicator's plot and enables the addition of the following features:
An equalizer-style display, with an attractive color and brightness gradient and a peak-hold marker
Max Hi / Max Low levels that can also be used for alerts (like RSI overbought /
RedK Multi-Modal TrailingStop (RedK MMTStop)█ RedK MMTStop - Release Notes
Introduction & background
RedK MMTStop is a Multi-Modal Trailing Stop indicator - Let's quickly explore the "trailing stop" concept first as a refresher - then explain what a multi-modal trailing stop indicator does.
A "Trailing Stop" is what helps traders avoid giving back profit because they held an open position for too long. A trailing stop follows (trails) the price movement in the trade direction - never moves in the opposite direction - as long as th
RedK DualTF Volume-Accelerated RSI (RedK_VARSI)█ RedK_VARSI — Release Notes
The idea behind RedK Dual Timeframe V olume- A ccelerated RSI (RedK_VARSI) is to enable traders to impose volume impact on the widely used RSI (Relative Strength Index) indicator - for improved "combined price action + volume" analysis - and then to visualize the resulting insight from 2 different timeframes simultaneously; the current (chart's) timeframe, and a higher timeframe (the Context timeframe) of their choice.
This analysis approach enables trader
อินดิเคเตอร์
RedK Relative Strength Ribbon: RS Ribbon and RS ChartsRedK Relative Strength Ribbon (RedK RS_Ribbon) is TA tool that plots the Relative Strength of the current chart symbol against another symbol, or an index of choice. It enables us to see when a stock is gaining strength (or weakness) relative to (an index that represents) the market, and when it hits new highs or lows of that relative strength, which may lead to better trading decisions.
I searched TV for existing RS indicators but didn't find what I really wanted, so I put this together and a
อินดิเคเตอร์
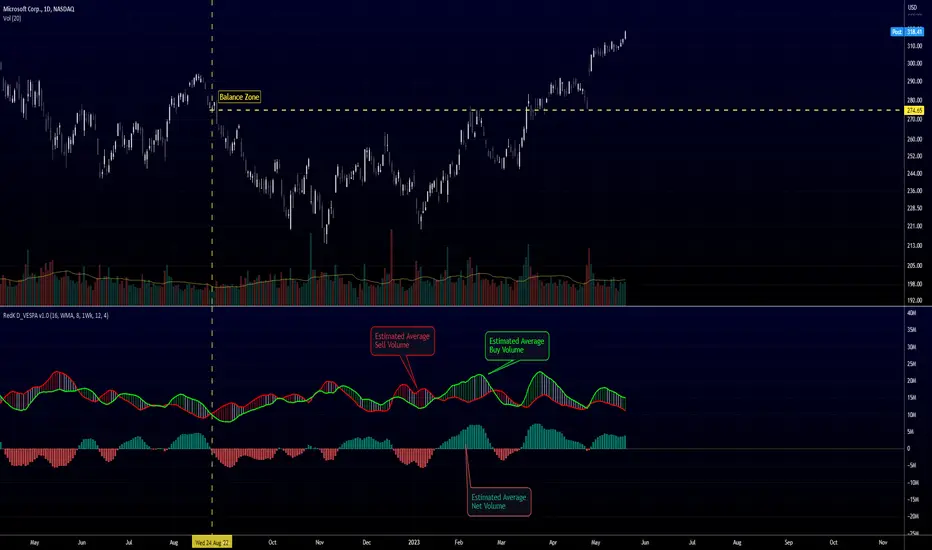
Directional Volume EStimate from Price Action (RedK D_VESPA)The "Directional Volume EStimate from Price Action (RedK D_VESPA)" is another weapon for the VPA (Volume Price Analysis) enthusiasts and traders who like to include volume-based insights & signals to their trading. The basic concept is to estimate the sell and buy split of the traded volume by extrapolating the price action represented by the shape of the associated price bar. We then create and plot an average of these "estimated buy & sell volumes" - the estimated average Net Volume is the b
อินดิเคเตอร์
RedK DIY ZLMA: Customizable Zero-Lag MA (Educational / Utility)This script is more of an educational / utility piece rather than a fully-fledged indicator - It provides an easy way to customize and produce a zero-lag Moving average that can then be used in various scenarios
What is DIY_ZLMA?
------------------------
The DIY ZLMA is for fans and enthusiasts of researching Moving Averages (like me) - the script enables the user to play around with one of the common approaches used to reduce lag in moving averages - which was explained in this old post belo
อินดิเคเตอร์
RedK EVEREX - Effort Versus Results ExplorerRedK EVEREX is an experimental indicator that explores "Volume Price Analysis" basic concepts and Wyckoff law "Effort versus Result" - by inspecting the relative volume (effort) and the associated (relative) price action (result) for each bar - showing the analysis as an easy to read "stacked bands" visual. From that analysis, we calculate a "Relative Rate of Flow" - an easy to use +100/-100 oscilator that can be used to trigger a signal when a bullish or bearish mode is detected for a certain u
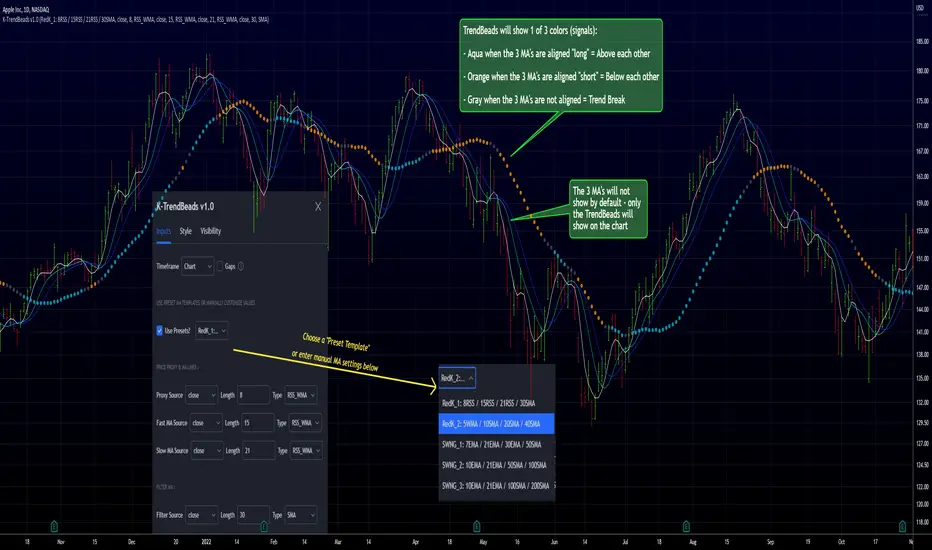
RedK TrendBeads: 3 x MA Crossover Signal with Preset TemplatesRedK TrendBeads is a super simple 3 x Moving Average Crossover Signal (Long/Short/Break) script that provides a simple and effective way for traders to identify potential trading opportunities. By combining three moving averages and only exposing a simple signal, the script helps filter out noise and focus on the trend and the trade execution.
Background
===========
A 3 x Moving Average Crossover strategy is a popular trading method in technical analysis . It uses the relationship between a fas
อินดิเคเตอร์
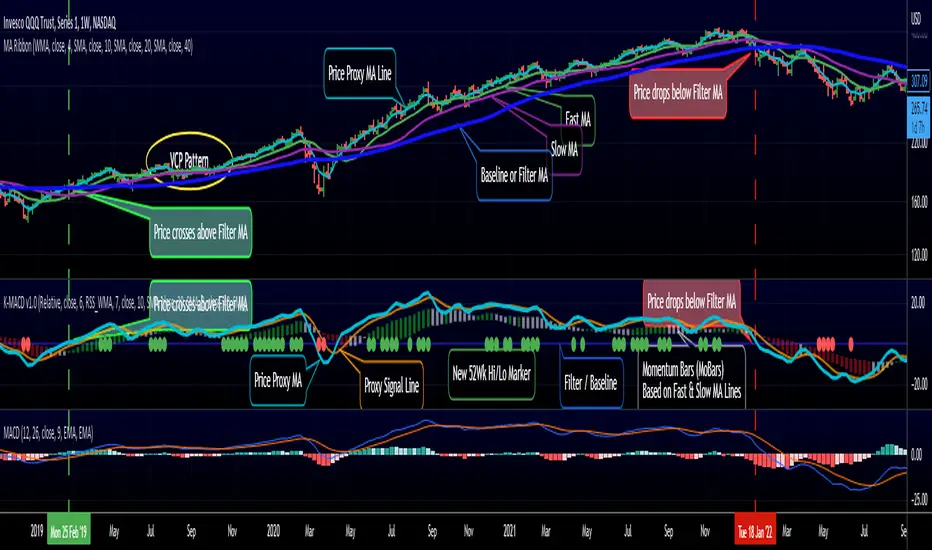
RedK K-MACD : a MACD with some more musclesMoving Averages are probably the most commonly used analysis tools, and MACD is possibly the first charting indicator a trader gets to learn about.
MACD Basic concept
----------------------------
Without repeating all the tons of documentation about what MACD does, let's quickly re-visit the MACD concept from a 10-mile altitude (note we're keen on simplifying here rather than being technically accurate - so please forgive the use of any "common lingos")
- MACD goal is to represent the distance
อินดิเคเตอร์
RedK Chop & Breakout Scout (C&B_Scout)The RedK Chop & Breakout Scout (C&BS or just CBS) is a centered oscillator that helps traders identify when the price is in a chop zone, where it's recommended to avoid trading or exit existing trades - and helps identify (good & tradeable) price breakouts.
i receive many questions asking for simple ways to identify chops .. Here's one way we can do that.
(This is work in progress - i was exploring with the idea, and wasn't sure how interesting other may find it. )
Quick Intro:
==============
อินดิเคเตอร์
RedK Dual VADER with Energy Bars (VADER-DEB)VADER-DEB is not really a new indicator - This is a "visually enhanced" version of the Volume-Accelerated Directional Energy Ratio (VADER) I recently published - here's the direct link to read more about how RedK VADER works and how to use it (click the chart below to visit the link)
The visual improvements I added in VADER-DEB helps bring more insight about the market action by
1) exposing the dual/long VADER plot by default (which we use as a proxy for sentiment) - and it shows now as an
อินดิเคเตอร์
RedK Momentum Bars (RedK Mo_Bars)Momentum Bars (Mo_Bars) offers a different way to visualize (relative) momentum - and uses some simple TA concepts to provide a different perspective into how we read momentum changes and incorporate that in our trading.
The idea here (and the script itself) is really super simple, and is (very loosely) inspired by Elder's Impulse System (EIS) - then evolved to leverage some other concepts, and to become less cluttering and "easier to read".
The construction of the Mo_Bars
--------------------
RedK Volume-Accelerated Directional Energy Ratio (RedK VADER)The Volume-Accelerated Directional Energy Ratio (VADER) makes use of price moves (displacement) and the associated volume (effort) to estimate the positive (buying) and negative (selling) "energy" behind the scenes, enabling traders to "read the market action" in more details and adjust their trading decisions accordingly.
How does VADER work?
------------------------------------
I have always been a fan of technical analysis concepts that are simple, and that integrate both price action and vo
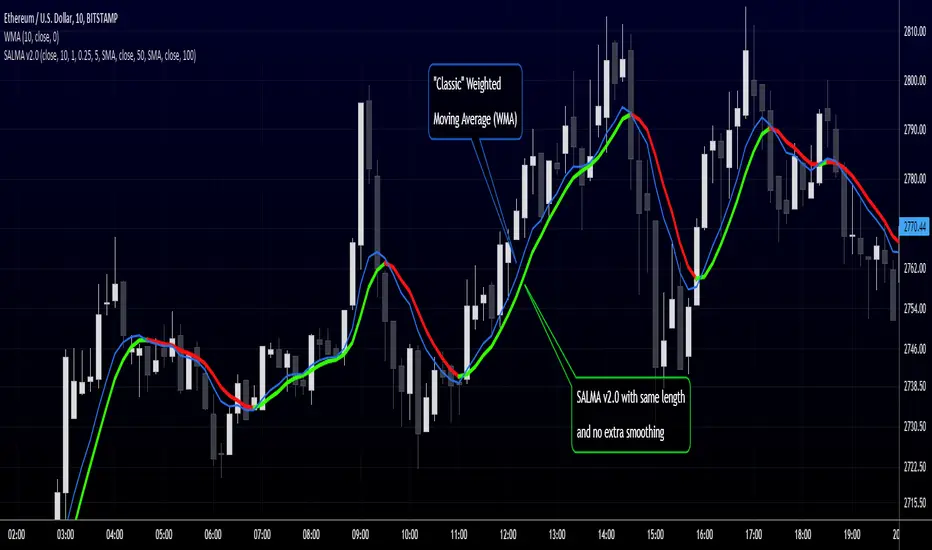
RedK Smooth And Lazy Moving Average (SALMA)Here's a quick and simple script that produces yet another Smooth and Lazy Moving Average - SALMA - that helps hide noise caused by extreme price fluctuations to enable better trend visualization and tracking
Concept:
===========
SALMA is based on a simple concept - we calculate a standard deviation channel of a user-selected width - then correct the price value so that it is restricted within the boundaries of the SD channel - effectively adjusting against high-volatility, sudden price moves -
อินดิเคเตอร์
RedK Auto-Stepping Ladder TraderThe RedK Auto-Stepping Ladder Trader is an experimental tool to help identify trade entry and exits for various types of trades (Trend / Momentum / Breakout and Swing trades)
The underlying concept here is loosely similar to the SMAC script - in case you'd like to read some of the "script-specific" write-up . I even borrowed some of the SMAC code, but upgraded the script to Pine v5 while working. So i won't repeat write-up here on how the script works - and we'll get right into how to use in t
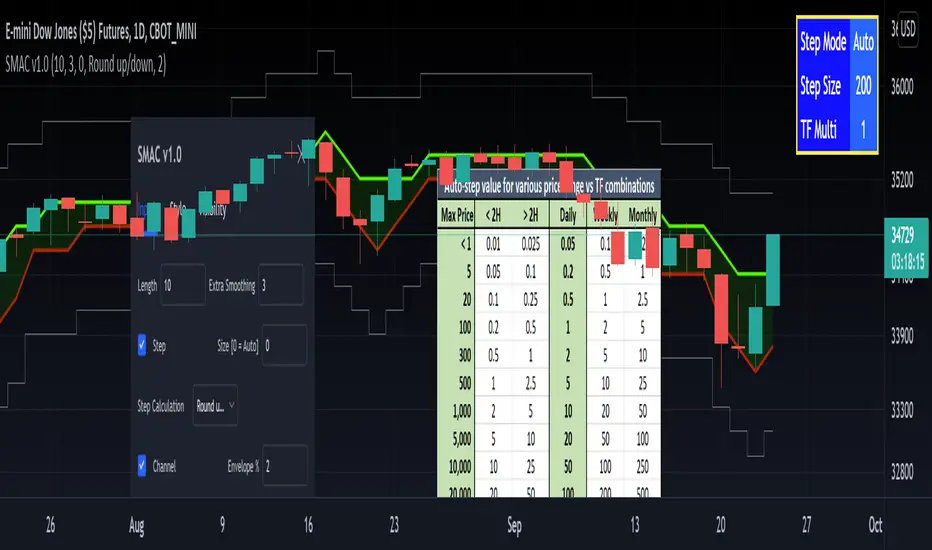
[RedK] Stepped Moving Average Channel (SMAC)The Stepping Moving Average Channel (SMAC) is not an indicator - It is more of a trading tool that was put together to enable a trader to take advantage of relatively fast price moves with quick incremental gain - maybe by exploiting opportunities to trade basic options (Calls, Puts) or to help with in/out-type swing trades. This is more a price-level visualization tool so please use it with this in mind, and not as a trading tool by itself.
While it looks very similar to a Donchian channel, SM
อินดิเคเตอร์
RedK Magic RibbonRedK Magic Ribbon is simple script that combines a fast and a slow moving averages to create a 2-Moving Average Cross-over / trend visualization tool.
We utilize the Compound Ratio Weighted Average (CoRa Wave) as the fast MA line and the RedK Slow Smooth Weighted Moving Average (RSS_WMA) aka LazyLine as the slow MA line.
i put this script together when i found that i started using these 2 moving average lines in my trading charts most of the time. thought others may find it useful.
Th
อินดิเคเตอร์
RedK Bar Strength Inspector / Bar Strength Index (BSI)Summary
=========
The Bar Strength Inspector / Bar Strength Index (BSI) is an indicator that evaluates each price bar against a user-selectable set of "strength categories" - BSI then calculates a combined score from these categories and provides an index - plotted as a centered oscillator - roughly similar to the way Relative Strength Index (RSI) works, which can be used to evaluate the strength of price move and the possibilities of trend continuation or reversal.
Background
=============
อินดิเคเตอร์
RedK Volume-Weighted Directional Efficiency Index (DXF)RedK Volume-Weighted Directional Efficiency Index (DXF) is a momentum indicator - that builds on Kaufman's Efficiency Ratio (ER) concept.
DXF utilizes a restricted +100/-100 oscillator to represent the "quality" of a trend, and does a good job in detecting the possibility of an upcoming trend change (in both direction and quality), improving our ability to make decisions on trade entries and exits.
Here's a quick background on Kaufman's Efficiency Ratio (ER)
------------------------------
อินดิเคเตอร์
RedK Portfolio Tracker [Table Version]RedK Portfolio Tracker is a simple tool that enables a trader to monitor and track a portfolio of up to 10 holdings (+ free cash) in real time - directly on the chart
Now that we have tables in Pine, this is a table version of my previously published Portfolio Tracker
- The table works better in visualizing the various table elements (title row, column labels..etc), and is more flexible in allowing color coding of gain/loss. for many traders, myself included, these simple visual signals are
RedK Slow_Smooth Average (RSS_WMA)RedK Slow Smooth Average (RSS_WMA) is based on simple, multi-WMA passes to generate a moving average that sacrifices low-lag and fast responsiveness for the sake of smoothness.
This smoothness enables an increased trader ability to visualize and track longer-term trends and removes the noise of smaller, relatively insignificant price fluctuations.
Notes:
=========
* RSS_WMA is deliberately built to be a "lazy line" - and it works in a different way to other common moving averages that attempt
RedK Compound Ratio Moving Average (CoRa_Wave)
Compound Ratio Weighted Average (CoRa_Wave) is a moving average where the weights increase in a "logarithmically linear" way - from the furthest point in the data to the current point - the formula to calculate these weights work in a similar way to how "compound ratio" works - you start with an initial amount, then add a consistent "ratio of the cumulative prior sum" each period until you reach the end amount. The result is, the "step ratio" between the weights is consistent - This is not the
RedK_Momentum-based Step MA (MoStep_MA)Summary
==========
This script plots a "momentum based" stepping Moving Average of various types - the idea is to visualize price moves in levels (or steps) to reduce "chart noise" - avoid getting caught in sideway moves - and enable better trade entry and exit decision.
How does the MoStep_MA Work:
=============================
- we first choose a "base MA" of our preferred type: WMA, EMA, SMA and Hull MA are available - this base MA will be visible in light gray on the chart and can be comple
อินดิเคเตอร์