เริ่มกันเลย
ชุมชน สคริปส์

buying

อินดิเคเตอร์ กลยุทธ์ และไลบรารี

ทุกประเภท
ทุกประเภท
อินดิเคเตอร์
กลยุทธ์
ไลบรารี
โอเพนซอร์สเท่านั้น
Buying and Selling Pressure Raw Multi (TG Fork)
BTCUSD: Buying and Selling Pressure Raw Multi (TG Fork)
tartigradia tartigradia P ที่อัปเดต: 

Visualize raw buying and selling pressure via 3 different calculation methods, all superimposed with dynamic rescaling. Buying and selling pressure is the concept of quantifying the disproportion between buying and selling. In practice, there is no single definitive way to calculate it. This indicator is a merge to display three different methods to calculate...

59
0
Pressure - Buying and Selling
BTCUSD: Pressure - Buying and Selling
monophobiafafe monophobiafafe

This is the Pressure Indicator. The Pressure Indicator analyzes a number of price ratios to measure the pressure of Buyers and Sellers. I’ve also added to the indicator: 1) Moving Averages (MA) – You can choose 3 types of MA: - Simple Moving Average (SMA) - Exponential Moving Average (EMA) - default - Volume Weighted Moving Average (VWMA) - Arnaud Legoux Moving...

45
0
Buying & Selling Pressure
SPX: Buying & Selling Pressure
fract fract P ที่อัปเดต: 

Buying and selling pressure is a volatility indicator which denotes the balance between buyers and sellers inside candlestick. You set the length to average it just like ATR. But This offers further break down of participants of the market. Pretty much at any condition of the market the indicator can filter out interesting details to make trading decisions...

381
19
Pro Trading Art - Insider Entry with alert
BTCUSDT: Pro Trading Art - Insider Entry with alert
protradingart protradingart P

This indicator is based on volume and ma. This will help you to detect higher volume on chart. You can create alert to stay updated. I am using Fibonacci golden ratio to multiply the current volume. My logic is if volume comes greater than factor of Fibonacci number and current volume then consider it as a insider entry.

70
0
Timeframe Time of Day Buying and Selling Strategy
BTCUSD: Timeframe Time of Day Buying and Selling Strategy
tormunddookie tormunddookie

This strategy allows you to back test longing or shorting or do nothing during time increments of 30 minutes. The price trends in one direction every 30 minutes and this strategy allows you to test various 30 minute time frames across a range of dates to capitalize on this. Make sure you are in the 30 minute time frame while viewing the performance and trade history.

138
0
Rolling Cumulative Volume
PPTBTC: Rolling Cumulative Volume
i_hodl i_hodl ที่อัปเดต: 

This indicator show a simple rolling cumulative volume. A field is specified. Then all last volume indicators are summed. For example it could calculate last 24h Volume if you use the 1h bars and set the length for 24.

109
3
Day's Buy Sell Volume label
MARUTI: Day's Buy Sell Volume label
TJalam TJalam P ที่อัปเดต: 

This indicator looks simple but it was bit tricky to code and to make it work on all time frames . I have used array in this to showcase the use of array, array give you more flexibly. It works on all time frame 1m 2m 3m 5m 10m 15m 30m 60m 120m. When the time frame is greater than the or equal to "D" it will show the current bar volume only. Total volume is...

773
74
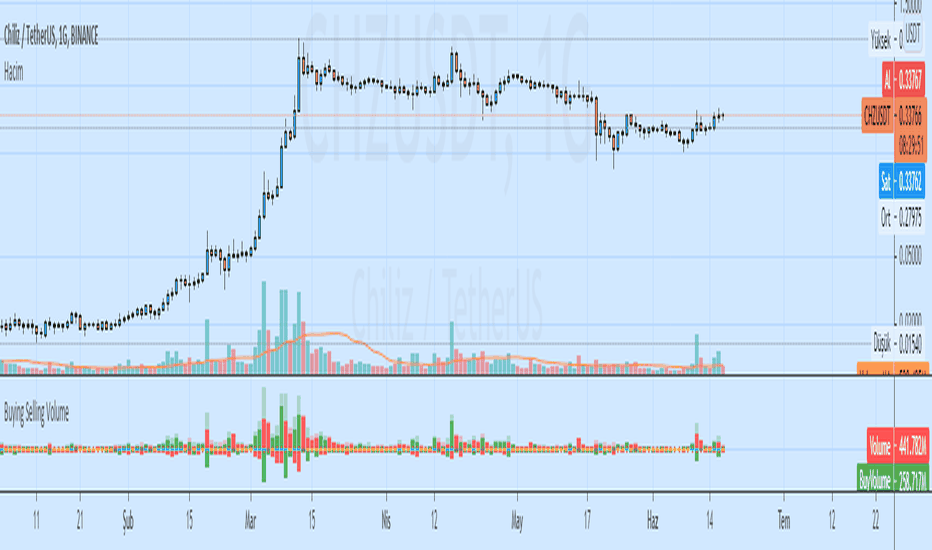
Buying Selling Volume
AMZN: Buying Selling Volume
ceyhun ceyhun ที่อัปเดต: 

Buying Selling Volume -Buy Volume -Sell Volume -Buy Volume Percent % -Sell Volume Percent % -Volume Index -Buy Sell Volume- BuyVolume>SellVolume=Blue barcolor SellVolume>BuyVolume=Purple barcolor -Volume Index- VolumeIndex>length and close > open =Cyan barcolor VolumeIndex>length and close < open =Gray barcolor VolumeIndex<=length = Yellow barcolor

3857
62
Buying and Selling Smoothed with Histogram
USDCAD: Buying and Selling Smoothed with Histogram
ceyhun ceyhun ที่อัปเดต: 

Buying and Selling Smoothed with Histogram Smoothed version with version with a red line representing the selling pressure and a green line which represents the Buying pressure. If the green line is above the red line it would mean that the Buying pressure is more and vice versa. The difference between the two is plotted as a Histogram. This is a cumulative...

341
8
Buying and Selling Pressure Raw
USDCAD: Buying and Selling Pressure Raw
ceyhun ceyhun

Buying and Selling Pressure Raw Raw Buying and selling pressure Indicator. The Raw buying and selling indication is provided in terms of a Columns. Green bars above zero show the buying pressure and the red bars below the zero line show the selling pressure. This presents a good visual representation of the dominating pressure.

554
8
Demand Index
BTCUSD: Demand Index
doughboy doughboy ที่อัปเดต: 

demand index

1983
24
รักในทุก #TradingView
50 ล้าน+

มีเทรดเดอร์และนักลงทุนเข้ามาเยี่ยมเราเพิ่มขึ้นในทุกๆเดือน

#1

เว็บไซต์ยอดนิยม ที่สุดในโลกเมื่อพูดถึงการลงทุนทุกอย่าง

4.9

คะแนนจากรีวิว 1M+ ไม่มีแอป การเงิน อื่นใดที่เป็นที่รักมากกว่านี้อีกแล้ว

10 ล้าน+

สคริปต์ ที่กำหนดเองและแนวคิดที่ผู้ใช้ของเราแบ่งปัน

ชาร์ต TradingView บน Instagram @rajbuzzz

@rajbuzzz

ชาร์ต TradingView บน Instagram @youngtraderwealth

@youngtraderwealth

ชาร์ต TradingView บน Instagram @reubenblameyfx

@reubenblameyfx

ชาร์ต TradingView บน Instagram @eagle_chart

@eagle_chart

ชาร์ต TradingView บน Instagram @orestkayd

@orestkayd

ชาร์ต TradingView บน Instagram @jackentrepreneur

@jackentrepreneur

ชาร์ต TradingView บน Instagram @garret_duke

@garret_duke

ชาร์ต TradingView บน Instagram BigDEUCE @FitradersRick

BigDEUCE @FitradersRick

ชาร์ต TradingView บน Instagram @WaltherCrypto

@WaltherCrypto

ชาร์ต TradingView บน Instagram @bright_james1988

@bright_james1988

ชาร์ต TradingView บน Instagram @aliams_david_trading_gram

@aliams_david_trading_gram

ชาร์ต TradingView บน Instagram @cryptoplayhouse

@cryptoplayhouse

ชาร์ต TradingView บน Instagram @livemarketforex

@livemarketforex

ชาร์ต TradingView บน Instagram @jonavrl02

@jonavrl02

ชาร์ต TradingView บน Instagram @itzi71

@itzi71

ชาร์ต TradingView บน Instagram @anybodycanshine

@anybodycanshine

ชาร์ต TradingView บน Instagram @jasmineeevn

@jasmineeevn

ชาร์ต TradingView บน Instagram @zegarratrader

@zegarratrader

อเล็กซ์ ฮอนโนลด์บนก้อนหิน

ไม่ว่าการเทรด

นี่คือสาเหตุนี่คือสาเหตุ
ผลิตภัณฑ์
  • ชาร์ต
  • Pine Script™
  • ตัวคัดกรองหุ้น
  • ตัวคัดกรองฟอเร็กซ์
  • ตัวคัดกรองคู่ Crypto
  • ตัวคัดกรองเหรียญคริปโต
  • ฮีทแมพหุ้น
  • Crypto Heatmap
  • ปฏิทินเศรษฐกิจ
  • ปฏิทินการรายงานผลประกอบการ
  • จุดประกาย
  • กระแสข่าว
  • TradingView Desktop
  • แอพมือถือ
  • ฟิวเจอร์สของ CME Group
บริษัท
  • เกี่ยวกับ
  • ฟีเจอร์
  • อัตราค่าบริการ
  • กำแพงแห่งรัก
  • นักกีฬา
  • แถลงการณ์
  • อาชีพ
  • บล็อก
  • ช่องโหว่ด้านความปลอดภัย
  • สถานะเพจ
  • ข้อตกลงการใช้งาน
  • คำจำกัดสิทธิ์ความรับผิดชอบ
  • นโยบายความเป็นส่วนตัว
  • นโยบายการใช้คุกกี้
ชุมชน
  • แนะนำเพื่อน
  • ไอเดีย
  • สคริปส์
  • สตรีม
  • กฎระเบียบการใช้งาน
  • ผู้ดูแลการใช้งาน
  • Pine Script™ Wizards
  • แชท
สำหรับธุรกิจ
  • วิดเจ็ต
  • การลงโฆษณา
  • โซลูชั่นสำหรับเว็บไซต์ & โบรกเกอร์
  • ชาร์ตโซลูชั่น
  • ไลบรารี่ของไลท์เวทชาร์ต
  • การเชื่อมต่อกับโบรกเกอร์
  • โปรแกรมพาร์ทเนอร์
ดาวน์โหลดบน App Store ดาวน์โหลดบน App Store ไปเอาได้ที่ Google Play ไปเอาได้ที่ Google Play
ดาวน์โหลดเดสก์ท็อปแอพ ดาวน์โหลดเดสก์ท็อปแอพ เทรดบน TradingView เทรดบน TradingView
ข้อมูลตลาดให้บริการโดย ICE Data Services © 2023 TradingView, Inc.