OPEN-SOURCE SCRIPT
🚦 Divergence Indicator for The Saty PO by TenAMTrader
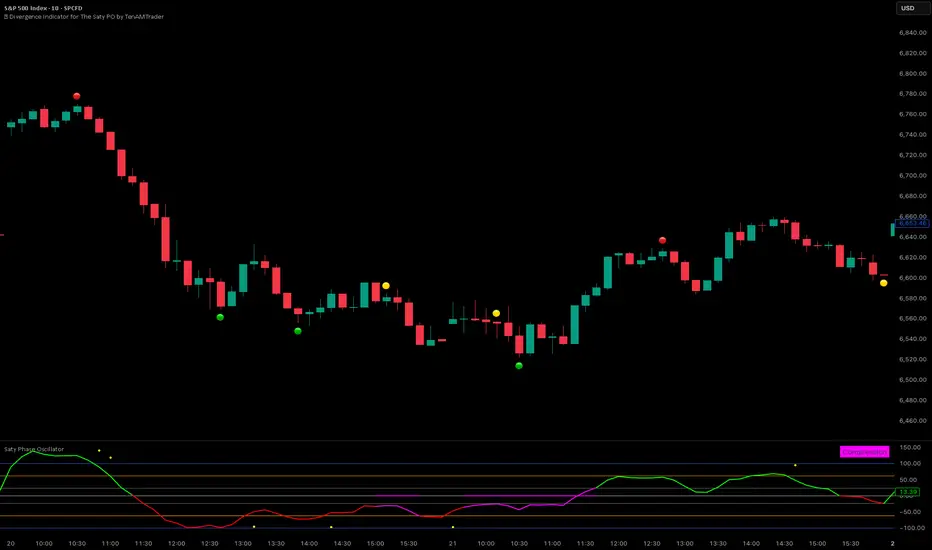
TenAM’s Traffic Light Divergence Indicator for The Saty Phase Oscillator
Overview:
This tool is designed to automatically detect regular and hidden divergences on price using data sourced from The Saty Phase Oscillator. Divergences are displayed directly on the chart using a simple traffic-light visual system:
🟢 Bullish Divergence
🔴 Bearish Divergence
🟡 Hidden Divergence
These markers highlight potential points of interest—not trade signals—based on the momentum behavior of the underlying oscillator relative to price.
How to Use:
Add The Saty Phase Oscillator to your chart.
Then load “TenAM’s Traffic Light Divergence Indicator for The Saty Phase Oscillator.”
IMPORTANT, In the indicator settings → Indicator Source, make sure you select:
Saty Phase Oscillator → Phase Oscillator
Set the indicator to plot on price (Settings → Style → "Overlay/Price").
Adjust detection preferences:
Enable Regular, Hidden, or both divergence types.
Configure Left and Right Pivot Lookbacks.
Recommended starting point: Right = 3, Left = 1.
Optimal values vary by timeframe and market—backtesting is encouraged.
Modify the Max Lookback Range (default: 60) and Min Lookback Range (default: 0) to refine how far back divergence scanning occurs.
Interpretation:
These are not buy or sell signals. They simply highlight areas where momentum and price behavior diverge, helping you evaluate potential entry opportunities or exhaustion zones.
Legal Disclaimer:
This indicator is for informational and educational purposes only. It does not constitute financial advice, investment advice, or a recommendation to buy or sell any security. Trading involves significant risk, and past performance does not guarantee future results. Users are fully responsible for their own trading decisions and outcomes. The creator of this script assumes no liability for any losses or damages arising from its use.
สคริปต์โอเพนซอร์ซ
ด้วยเจตนารมณ์หลักของ TradingView ผู้สร้างสคริปต์นี้ได้ทำให้เป็นโอเพนซอร์ส เพื่อให้เทรดเดอร์สามารถตรวจสอบและยืนยันฟังก์ชันการทำงานของมันได้ ขอชื่นชมผู้เขียน! แม้ว่าคุณจะใช้งานได้ฟรี แต่โปรดจำไว้ว่าการเผยแพร่โค้ดซ้ำจะต้องเป็นไปตาม กฎระเบียบการใช้งาน ของเรา
คำจำกัดสิทธิ์ความรับผิดชอบ
ข้อมูลและบทความไม่ได้มีวัตถุประสงค์เพื่อก่อให้เกิดกิจกรรมทางการเงิน, การลงทุน, การซื้อขาย, ข้อเสนอแนะ หรือคำแนะนำประเภทอื่น ๆ ที่ให้หรือรับรองโดย TradingView อ่านเพิ่มเติมใน ข้อกำหนดการใช้งาน