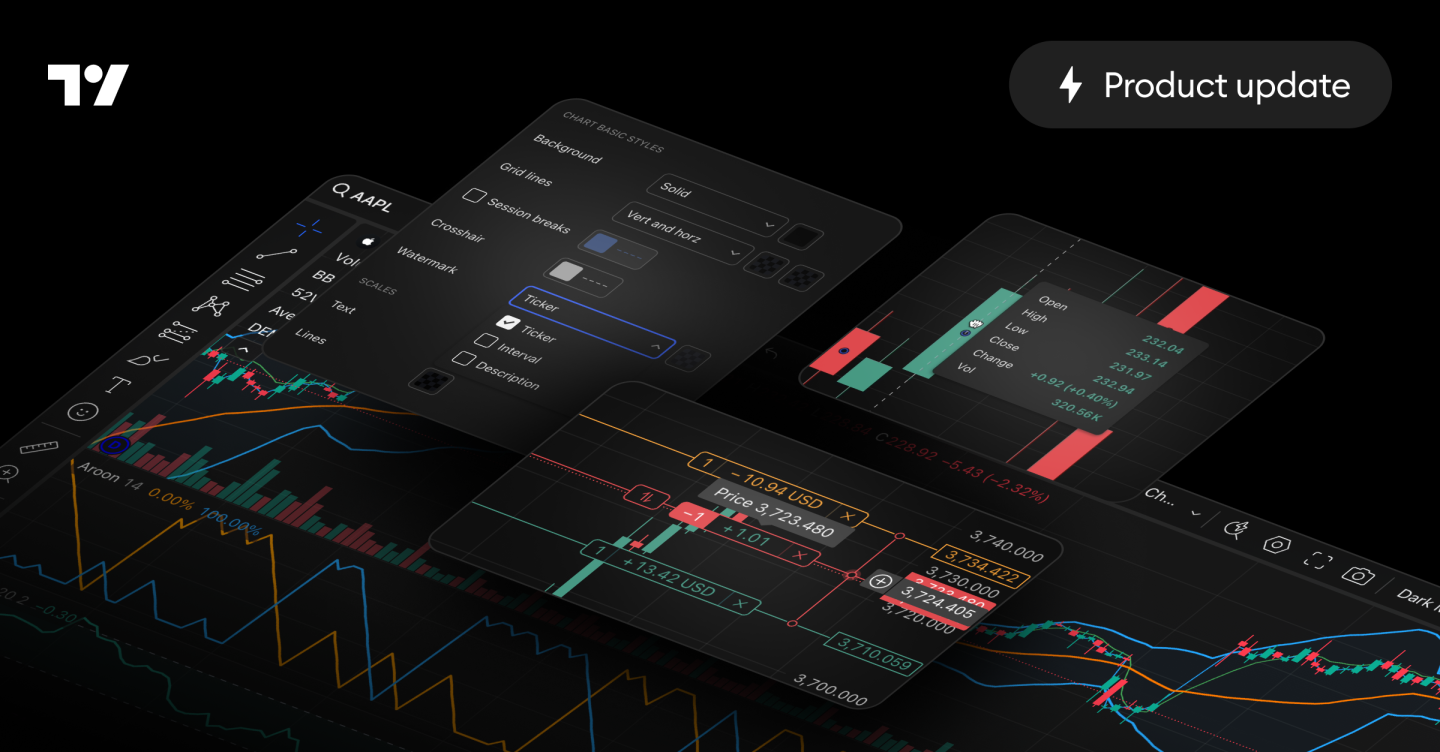
Version 30.0.0
Another major release is here, packed with features and resources designed to make the integration process faster, charting features better, and your native solution more powerful. Let’s dive into the highlights.
Key updates
New floating tooltip for detailed bar analysis
A new floating tooltip now appears after a long press on the chart, displaying detailed OHLC values and the price change for the selected bar.
The tooltip follows your cursor or finger as you move across the chart, providing a seamless way to analyze data.
To disable this feature, use the long_press_floating_tooltip featureset.
Inactivity gaps on daily, weekly, and monthly charts
To provide a more accurate analysis of traded assets, we've extended inactivity gaps beyond intraday charts. You can now display gaps for periods with no trading activity on daily, weekly, and monthly timeframes. This gives users a better representation of time for instruments that don't trade every day.
This feature is enabled via the new inactivity_gaps featureset, which replaces the previous intraday-only version.
Learn more about showing gaps on the chart.
New visibility controls in watermarks
You now have granular control over the default chart watermark. We've added new API methods and corresponding UI checkboxes to independently toggle the visibility of the ticker, interval, and description. This allows you to set a cleaner default state programmatically, and gives end-users the power to customize the watermark to their exact preference through the chart settings.

Updated Broker sample
The Broker API is the heart of our trading integration. To simplify your start, we’ve updated our broker sample 🔐 (access is restricted) so you can develop faster and with more clarity.
Choose between two distinct paths: a minimalist scaffold with only the essentials for our new step-by-step tutorial or a feature-rich mock that demonstrates advanced functionality like bracket orders. This new structure gives you the flexibility to either build from the ground up or learn from a complete example, streamlining your development process.
Instant trading info with enhanced tooltips
To make it easier to read trading information on a busy chart, we've added price and profit/loss (P&L) details directly to the tooltips for positions, orders, and brackets. Simply hover over any on-chart trading line to see its exact price and current P&L at a glance, without searching for crowded labels on the price axis.
A more intuitive Trading Settings panel
Meet the reworked Trading Settings panel, designed to be more intuitive and user-friendly. Clear descriptions now appear under checkboxes, removing any guesswork when customizing the view. A new toggle also lets you instantly hide Profit & loss information for both positions and brackets.

Watchlists now update across all your tabs
To create a more seamless user experience, watchlists are now automatically synchronized across all open browser tabs. Changes made in one tab, like adding or removing a symbol, instantly appear everywhere else.
This feature is enabled by default and requires the use_localstorage_for_settings featureset.
To disable the feature, use the watchlist_cross_tab_sync featureset.
Documentation
Great features reach their full potential only when they're easy to understand and to use. That’s why our documentation focuses on explanations and practical examples, so you can go from idea to implementation faster.
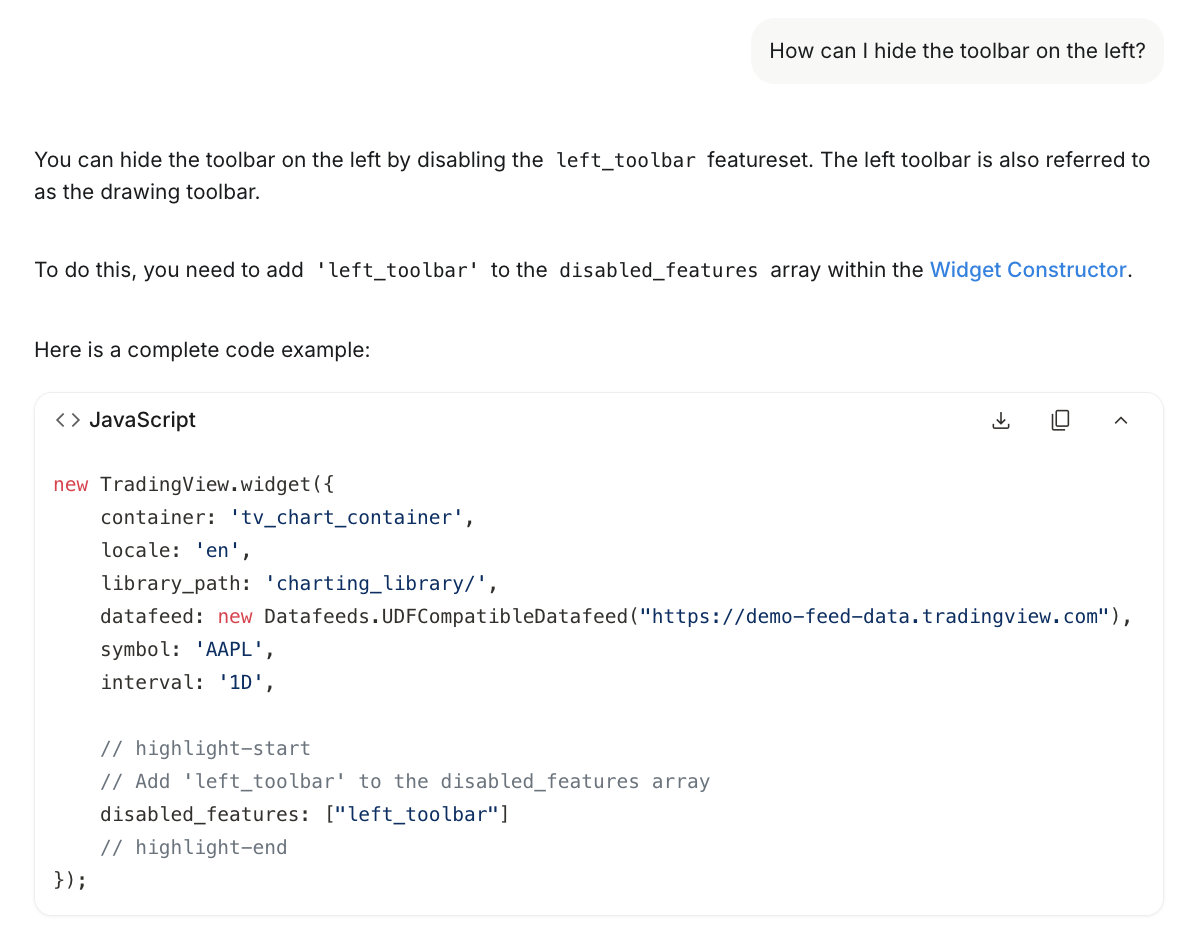
Build your own AI expert
Many of you already use AI assistants to explore our library and write code. Yet it's frustrating when a generic model hallucinates an answer or suggests a deprecated API based on outdated training data.
The power is now directly in your hands with a downloadable documentation file. This is a comprehensive base containing our complete, up-to-date documentation and full TypeScript definitions. By feeding this file to a modern LLM, you transform a general-purpose AI into a dedicated expert on our library. Ask complex questions, request full code examples, and get reliable, context-aware answers instantly. Learn how to set up your AI library assistant.
New guides
We've also shipped a batch of new articles to tackle common questions and clarify powerful features:
- Customization with Watermarks. Learn how to dynamically control content, color, and visibility of chart watermarks.
- Best practices for Profit & Loss. Ensure the P&L values in your UI match your backend perfectly. This article explains why you should provide your own P&L data and shows you exactly how to do it, preventing discrepancies and building user trust.
Conclusion
This release is about giving you better tools, clearer documentation, and more control over the user experience. This post covers the highlights — for the full list of updates, improvements, and fixes, see the Release notes.