🧠 Chart Analysis Summary:
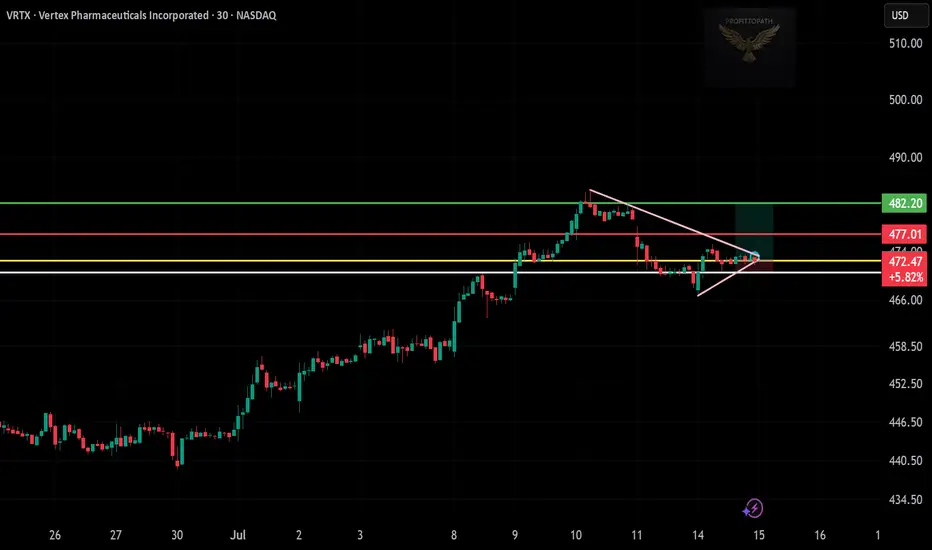
Pattern: A symmetrical triangle is visible, tightening toward the apex with a breakout just forming.
Current Price: $472.47 (breakout near)
Key Levels:
Support Zone: Around $468–470 (white/yellow zone)
Resistance Zone:
First Target: $477.01 (red line)
Major Target: $482.20 (green line)
Volume Confirmation: Suggested to confirm breakout with volume increase.
📊 Trade Idea (Long Setup):
Entry: $472.50–473.00
Target 1: $477.00
Target 2: $482.00
Stop-Loss: Below $468.00
คำจำกัดสิทธิ์ความรับผิดชอบ
ข้อมูลและบทความไม่ได้มีวัตถุประสงค์เพื่อก่อให้เกิดกิจกรรมทางการเงิน, การลงทุน, การซื้อขาย, ข้อเสนอแนะ หรือคำแนะนำประเภทอื่น ๆ ที่ให้หรือรับรองโดย TradingView อ่านเพิ่มเติมใน ข้อกำหนดการใช้งาน
คำจำกัดสิทธิ์ความรับผิดชอบ
ข้อมูลและบทความไม่ได้มีวัตถุประสงค์เพื่อก่อให้เกิดกิจกรรมทางการเงิน, การลงทุน, การซื้อขาย, ข้อเสนอแนะ หรือคำแนะนำประเภทอื่น ๆ ที่ให้หรือรับรองโดย TradingView อ่านเพิ่มเติมใน ข้อกำหนดการใช้งาน