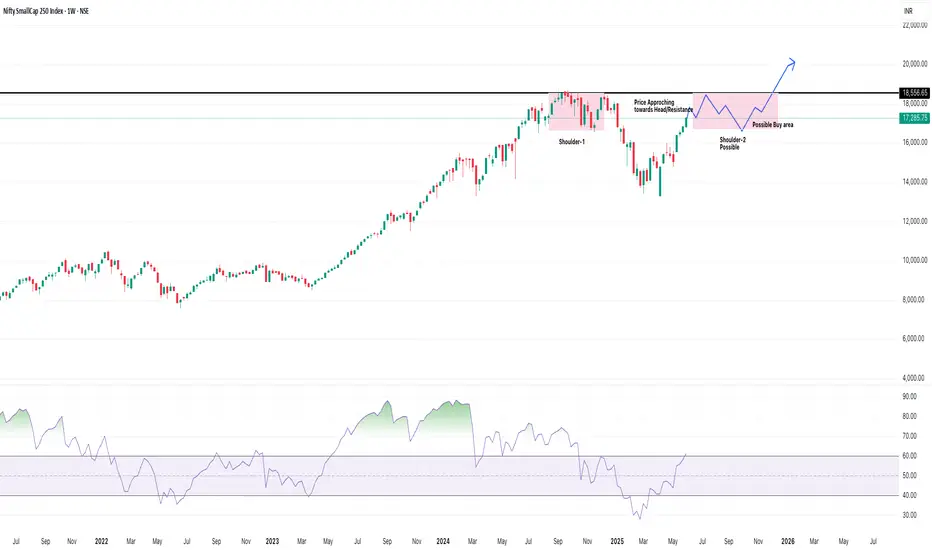
Formation of a Potential Head and Shoulders Pattern: The chart highlights the formation of what appears to be a "Shoulder-1" and a "Head" (the peak where resistance was met). A "Shoulder-2 Possible" is also indicated, suggesting the potential completion of an Inverse Head and Shoulders pattern.
Shoulder-1: The first peak on the left side before the main "Head."
Head: The highest point reached, coinciding with the strong resistance level.
Possible Shoulder-2: The current price action is forming what could be the right shoulder of the pattern.
"Price Approaching Towards Head/Resistance": The annotation correctly points out that the price is currently moving towards the "Head" and the strong resistance level at 18,505.05.
"Possible Buy Area": A green horizontal line around 16,900-17,000, labeled "Possible Buy area," suggests that if the price pulls back after testing the resistance, this region could offer a buying opportunity, potentially forming the right shoulder.
Projected Price Path: The chart shows a blue curved arrow indicating a potential future trajectory: a test of the resistance, a pullback to the "Possible Buy area" (to form Shoulder-2), and then a strong breakout above the 18,505.05 resistance towards higher levels (indicated by the upward blue arrow towards 20,000+).
คำจำกัดสิทธิ์ความรับผิดชอบ
ข้อมูลและบทความไม่ได้มีวัตถุประสงค์เพื่อก่อให้เกิดกิจกรรมทางการเงิน, การลงทุน, การซื้อขาย, ข้อเสนอแนะ หรือคำแนะนำประเภทอื่น ๆ ที่ให้หรือรับรองโดย TradingView อ่านเพิ่มเติมใน ข้อกำหนดการใช้งาน
คำจำกัดสิทธิ์ความรับผิดชอบ
ข้อมูลและบทความไม่ได้มีวัตถุประสงค์เพื่อก่อให้เกิดกิจกรรมทางการเงิน, การลงทุน, การซื้อขาย, ข้อเสนอแนะ หรือคำแนะนำประเภทอื่น ๆ ที่ให้หรือรับรองโดย TradingView อ่านเพิ่มเติมใน ข้อกำหนดการใช้งาน