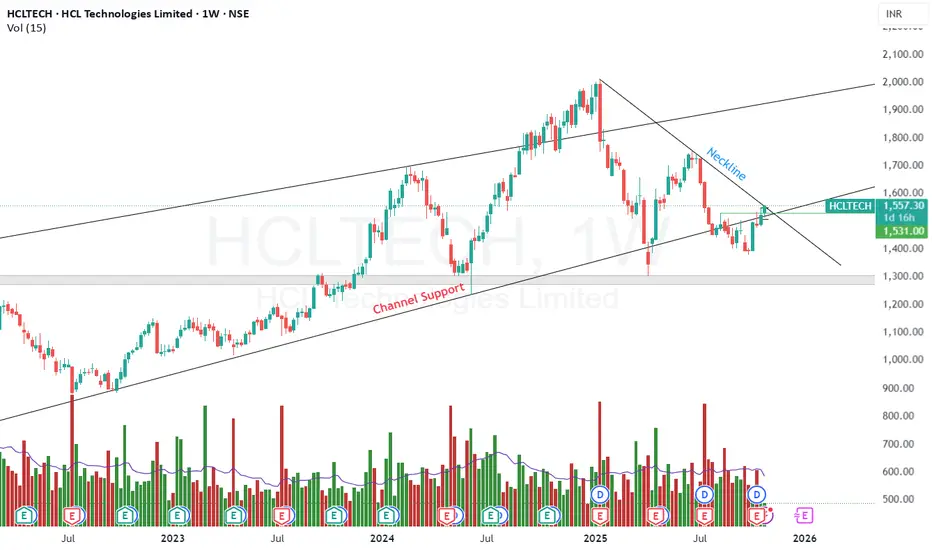
HCLTECH – Channel Bottom Support & Multiple Breakouts | Short-Term Bullish Setup
For Study Purpose Only
🕒 Timeframe: Weekly & Daily
💡 Pattern: Channel Support + Neckline/Trendline Breakout
📈 Current Zone: Near Channel Bottom
🎯 Bias: Short-Term Bullish
🧭 Technical View:
On the weekly chart, HCL Tech has taken strong support near the lower boundary of its ascending channel, indicating the continuation of the prevailing uptrend structure. A bullish reversal candle on the weekly timeframe further confirms buying interest at this crucial support zone.
On the daily chart, the price has given a decisive breakout above the neckline/trendline resistance, supported by a series of multiple inside bar breakouts, showing momentum buildup and strength in the short-term structure.
The stock is now trading above key moving averages, and with follow-through confirmation, it may continue its upward trajectory in the coming sessions.
📊 Study Highlights:
Weekly chart: strong rebound from channel bottom
Daily chart: neckline/trendline breakout confirmed
Multiple inside bar breakouts indicate strength
Weekly candle shows reversal formation
Short-term bullish momentum emerging
⚠️ Disclaimer:
This analysis is purely for educational and study purposes only. Not a buy/sell recommendation. Always conduct your own due diligence before taking any trading decision.
คำจำกัดสิทธิ์ความรับผิดชอบ
ข้อมูลและบทความไม่ได้มีวัตถุประสงค์เพื่อก่อให้เกิดกิจกรรมทางการเงิน, การลงทุน, การซื้อขาย, ข้อเสนอแนะ หรือคำแนะนำประเภทอื่น ๆ ที่ให้หรือรับรองโดย TradingView อ่านเพิ่มเติมที่ ข้อกำหนดการใช้งาน
คำจำกัดสิทธิ์ความรับผิดชอบ
ข้อมูลและบทความไม่ได้มีวัตถุประสงค์เพื่อก่อให้เกิดกิจกรรมทางการเงิน, การลงทุน, การซื้อขาย, ข้อเสนอแนะ หรือคำแนะนำประเภทอื่น ๆ ที่ให้หรือรับรองโดย TradingView อ่านเพิ่มเติมที่ ข้อกำหนดการใช้งาน