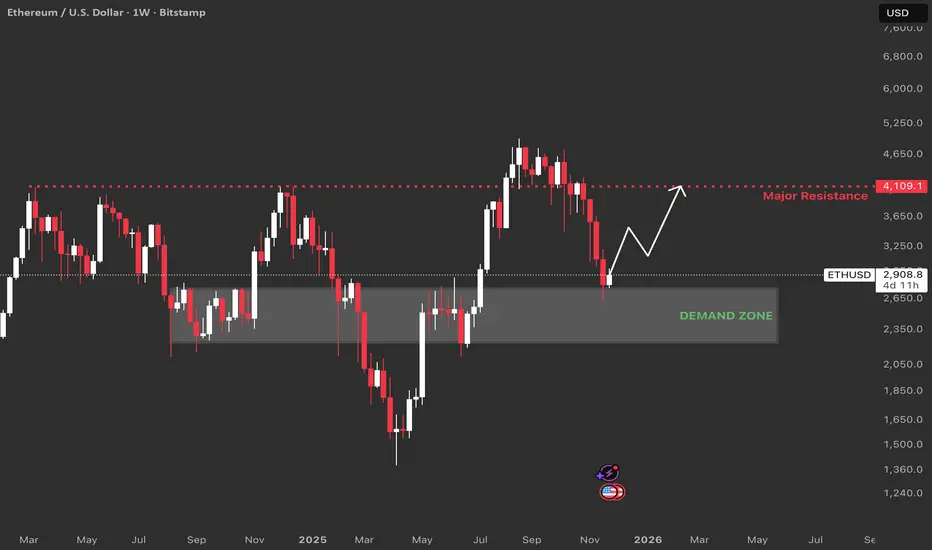
Demand Zone: This area marks where ETH found buyers over multiple months, rejecting further declines. Historically, when price revisits this zone after a sell-off, it tends to bounce. The recent reaction confirms buyers are active and defending this level.
Major Resistance (4,109 USD): It shows a prior weekly high and an expected supply or resistance area. This level also aligns with a golden pocket Fibb level, making it a confluence point where sellers could re-enter or bulls take profits.
Invalidation point: Weekly close below demand zone or multiple rejections with lower highs near demand.
คำจำกัดสิทธิ์ความรับผิดชอบ
ข้อมูลและบทความไม่ได้มีวัตถุประสงค์เพื่อก่อให้เกิดกิจกรรมทางการเงิน, การลงทุน, การซื้อขาย, ข้อเสนอแนะ หรือคำแนะนำประเภทอื่น ๆ ที่ให้หรือรับรองโดย TradingView อ่านเพิ่มเติมใน ข้อกำหนดการใช้งาน
คำจำกัดสิทธิ์ความรับผิดชอบ
ข้อมูลและบทความไม่ได้มีวัตถุประสงค์เพื่อก่อให้เกิดกิจกรรมทางการเงิน, การลงทุน, การซื้อขาย, ข้อเสนอแนะ หรือคำแนะนำประเภทอื่น ๆ ที่ให้หรือรับรองโดย TradingView อ่านเพิ่มเติมใน ข้อกำหนดการใช้งาน