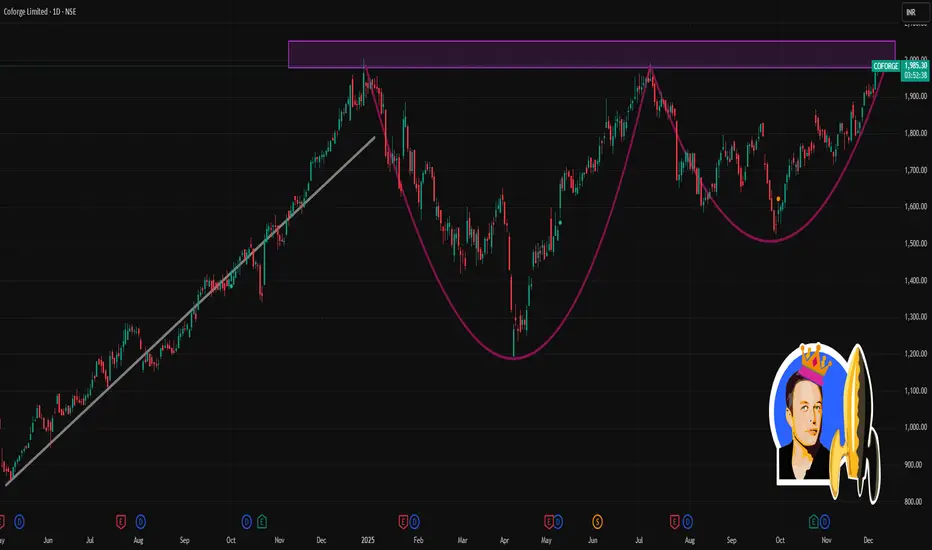
📈 Current Price & Range (as on recent close)
Last traded price: ~ ₹1,966.20
Day’s low–high: ~ ₹1,917.80 – ₹1,986.00
🧭 Key Moving‑Average & Technical Context
On daily chart, short‑ and medium‑term SMAs/EMAs (5‑, 10‑, 20‑, 50‑, 100‑, 200‑day) are all in “outperform” configuration — indicating bullish bias.
Other indicators on daily chart — RSI, MACD, Stochastic, ROC, CCI etc — are also showing strength (many in “outperform” zone).
⚠️ What to Monitor / What Can Happen
If Coforge breaks above ~₹1,986 with good volume — could extend higher, possibly retesting upper ranges near ₹2,000 (52‑week highs ~₹2,005).
If price falls below ~₹1,915 and fails to hold, next support zones around ~₹1,900 — and if that breaks, ~₹1,840‑₹1,850 becomes the important cushion.
Given strong moving‑average alignment plus bullish oscillator values, trend bias remains upward — but day‑to‑day volatility can still cause swings, so intraday trades should use tight stop‑loss.
การนำเสนอที่เกี่ยวข้อง
คำจำกัดสิทธิ์ความรับผิดชอบ
ข้อมูลและบทความไม่ได้มีวัตถุประสงค์เพื่อก่อให้เกิดกิจกรรมทางการเงิน, การลงทุน, การซื้อขาย, ข้อเสนอแนะ หรือคำแนะนำประเภทอื่น ๆ ที่ให้หรือรับรองโดย TradingView อ่านเพิ่มเติมใน ข้อกำหนดการใช้งาน
การนำเสนอที่เกี่ยวข้อง
คำจำกัดสิทธิ์ความรับผิดชอบ
ข้อมูลและบทความไม่ได้มีวัตถุประสงค์เพื่อก่อให้เกิดกิจกรรมทางการเงิน, การลงทุน, การซื้อขาย, ข้อเสนอแนะ หรือคำแนะนำประเภทอื่น ๆ ที่ให้หรือรับรองโดย TradingView อ่านเพิ่มเติมใน ข้อกำหนดการใช้งาน