Welcome to My Analysis.
Now, let’s break down today’s Bitcoin structure.
Bitcoin isn’t bullish yet — it’s just ranging inside a downtrend.
And unless one level breaks, the market is preparing for another move down.
Here’s the breakdown.
Market Structure
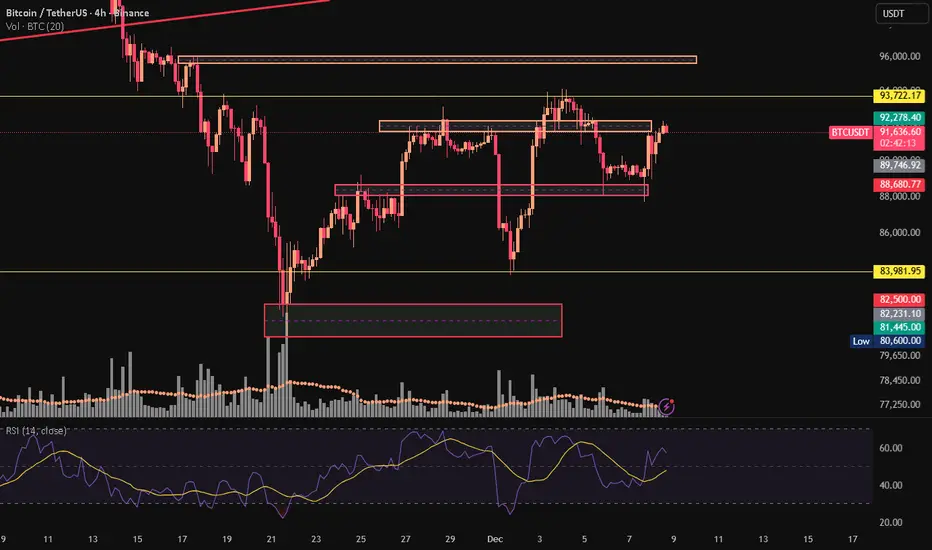
The primary trend is still bearish — price is trading below broken structures and several major resistances.
The current move is mostly a corrective rally inside the downtrend, not the start of a new uptrend.
Price action & candle behavior
Price is currently oscillating inside a tight range between 89,800 and 93,700.
The recent upward move is a correction wave inside the bearish structure.
The last pullback bounced exactly off 88.7K support, and price is now heading back toward the range top.
Volume
There was a strong volume spike at the 88.7K bottom → indicating buyer entry.
However, volume has declined during the recent rise, which shows the rally lacks full conviction.
RSI
RSI bounced from the range bottom (near 30).
A small bullish divergence is visible.
Still, RSI remains well below buyer power (below 70) → the upside is not yet fully confirmed.
Final summary
Overall structure: still bearish.
We are inside a corrective range within a downtrend.
93,700 is the key level for either breakout or reversal.
Until 93,700 is cleanly broken, the range continues and the probability of another drop back to 88.7K is high.
Deeper supports: 84K → 82K.
⚠️ Risk Alert ⚠️
Futures are not beginner-friendly. These triggers require solid experience.
Before using them, study risk management and practice with the learning content here.
Now, let’s break down today’s Bitcoin structure.
Bitcoin isn’t bullish yet — it’s just ranging inside a downtrend.
And unless one level breaks, the market is preparing for another move down.
Here’s the breakdown.
Market Structure
The primary trend is still bearish — price is trading below broken structures and several major resistances.
The current move is mostly a corrective rally inside the downtrend, not the start of a new uptrend.
Price action & candle behavior
Price is currently oscillating inside a tight range between 89,800 and 93,700.
The recent upward move is a correction wave inside the bearish structure.
The last pullback bounced exactly off 88.7K support, and price is now heading back toward the range top.
Volume
There was a strong volume spike at the 88.7K bottom → indicating buyer entry.
However, volume has declined during the recent rise, which shows the rally lacks full conviction.
RSI
RSI bounced from the range bottom (near 30).
A small bullish divergence is visible.
Still, RSI remains well below buyer power (below 70) → the upside is not yet fully confirmed.
Final summary
Overall structure: still bearish.
We are inside a corrective range within a downtrend.
93,700 is the key level for either breakout or reversal.
Until 93,700 is cleanly broken, the range continues and the probability of another drop back to 88.7K is high.
Deeper supports: 84K → 82K.
⚠️ Risk Alert ⚠️
Futures are not beginner-friendly. These triggers require solid experience.
Before using them, study risk management and practice with the learning content here.
คำจำกัดสิทธิ์ความรับผิดชอบ
ข้อมูลและบทความไม่ได้มีวัตถุประสงค์เพื่อก่อให้เกิดกิจกรรมทางการเงิน, การลงทุน, การซื้อขาย, ข้อเสนอแนะ หรือคำแนะนำประเภทอื่น ๆ ที่ให้หรือรับรองโดย TradingView อ่านเพิ่มเติมใน ข้อกำหนดการใช้งาน
คำจำกัดสิทธิ์ความรับผิดชอบ
ข้อมูลและบทความไม่ได้มีวัตถุประสงค์เพื่อก่อให้เกิดกิจกรรมทางการเงิน, การลงทุน, การซื้อขาย, ข้อเสนอแนะ หรือคำแนะนำประเภทอื่น ๆ ที่ให้หรือรับรองโดย TradingView อ่านเพิ่มเติมใน ข้อกำหนดการใช้งาน