Bitcoin (BTC) – Weekly Technical Overview
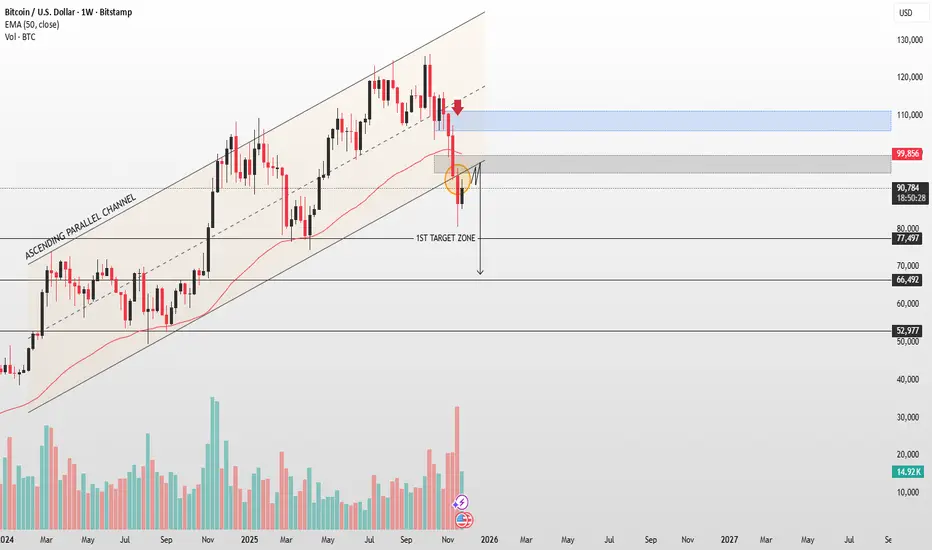
BTC has broken down from its long-standing ascending parallel channel, confirming a shift in trend momentum. Price rejected strongly from the key resistance zone near $110K, followed by an impulsive drop below the 50-week EMA, which is now acting as dynamic resistance.
Current weekly structure shows a relief bounce toward the previous support-turned-resistance zone ($95K–$100K). Failure to reclaim this level keeps downside pressure intact. A lower-high formation in this area would reinforce bearish continuation.
The chart highlights a first target zone around $77K–$80K, aligned with major horizontal support. A deeper extension remains possible toward the next structural demand region near $66K and ultimately $53K, if selling accelerates.
Overall sentiment remains bearish while below the EMA and broken channel support. Bulls need a decisive weekly close back above $100K to regain control.
การซื้อขายยังคงดำเนินอยู่
Smart trades begin with smart signals. Join us
t.me/NabeelaFatima
Gold, Forex & Crypto
Your edge starts here
t.me/NabeelaFatima
t.me/NabeelaFatima
Gold, Forex & Crypto
Your edge starts here
t.me/NabeelaFatima
คำจำกัดสิทธิ์ความรับผิดชอบ
ข้อมูลและบทความไม่ได้มีวัตถุประสงค์เพื่อก่อให้เกิดกิจกรรมทางการเงิน, การลงทุน, การซื้อขาย, ข้อเสนอแนะ หรือคำแนะนำประเภทอื่น ๆ ที่ให้หรือรับรองโดย TradingView อ่านเพิ่มเติมใน ข้อกำหนดการใช้งาน