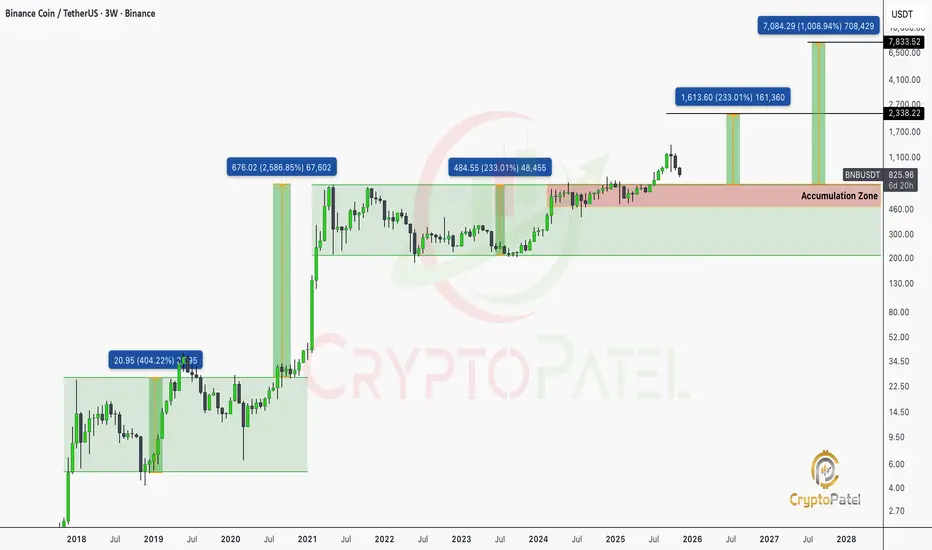
BNB/USDT 3-Week Chart Analysis: Is a Massive Breakout Coming?
Current Price: $827.05 (down 10.74%)
BNB is currently consolidating in a key Accumulation Zone between $700-$800, signaling institutional accumulation and balance.
Key Levels to Watch
Support Zones:
🔹 $484.55 – Critical demand from 2023 lows
🔹 $676.02 – Former ATH turned support
🔹 $700-$750 – Bottom of current accumulation
Resistance Targets:
🔹 $1,613 – First major upside
🔹 $2,338 – Next intermediate target
🔹 $7,084 – Long-term “moonshot” scenario
Volume & Structure Insights
🔹 2019 Breakout: Started the long-term uptrend
🔹 2021 Bull Run: Peak at $676, classic blow-off top
🔹 2024-2025 Accumulation: Renewed institutional interest
Bearish Risk
🔹 Failure to hold $700 → Retest $484 (-41%)
🔹 Breakdown below $484 → Bullish thesis invalid
NFA & DYOR
Twitter: twitter.com/CryptoPatel
Telegram: t.me/OfficialCryptoPatel
Instagram: instagram.com/cryptopatel?utm_medium=copy_link
Telegram: t.me/OfficialCryptoPatel
Instagram: instagram.com/cryptopatel?utm_medium=copy_link
คำจำกัดสิทธิ์ความรับผิดชอบ
ข้อมูลและบทความไม่ได้มีวัตถุประสงค์เพื่อก่อให้เกิดกิจกรรมทางการเงิน, การลงทุน, การซื้อขาย, ข้อเสนอแนะ หรือคำแนะนำประเภทอื่น ๆ ที่ให้หรือรับรองโดย TradingView อ่านเพิ่มเติมใน ข้อกำหนดการใช้งาน