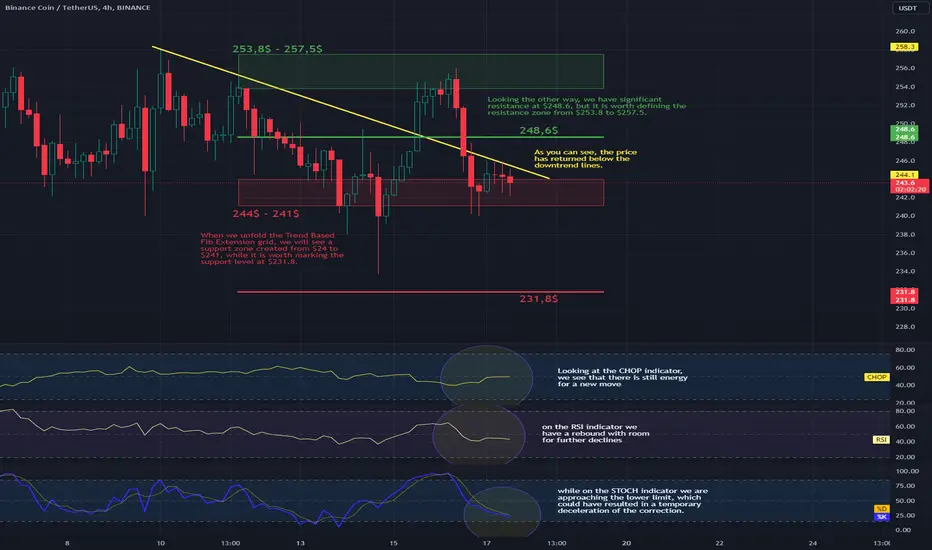
Hello everyone, let's take a look at the BNB to USDT chart on a 4-hour time frame. As you can see, the price has returned below the downtrend lines.
When we unfold the Trend Based Fib Extension grid, we will see a support zone created from $24 to $241, while it is worth marking the support level at $231.8.
Looking the other way, we have significant resistance at $248.6, but it is worth defining the resistance zone from $253.8 to $257.5.
Looking at the CHOP indicator, we see that there is still energy for a new move, on the RSI indicator we have a rebound with room for further declines, while on the STOCH indicator we are approaching the lower limit, which could have resulted in a temporary deceleration of the correction.
คำจำกัดสิทธิ์ความรับผิดชอบ
ข้อมูลและบทความไม่ได้มีวัตถุประสงค์เพื่อก่อให้เกิดกิจกรรมทางการเงิน, การลงทุน, การซื้อขาย, ข้อเสนอแนะ หรือคำแนะนำประเภทอื่น ๆ ที่ให้หรือรับรองโดย TradingView อ่านเพิ่มเติมใน ข้อกำหนดการใช้งาน
คำจำกัดสิทธิ์ความรับผิดชอบ
ข้อมูลและบทความไม่ได้มีวัตถุประสงค์เพื่อก่อให้เกิดกิจกรรมทางการเงิน, การลงทุน, การซื้อขาย, ข้อเสนอแนะ หรือคำแนะนำประเภทอื่น ๆ ที่ให้หรือรับรองโดย TradingView อ่านเพิ่มเติมใน ข้อกำหนดการใช้งาน