Based on the charts and the market's performance on Tuesday, October 14, the Bank Nifty experienced a sharp reversal from its highs and a breakdown from its short-term ascending channel. The momentum has shifted to a short-term corrective bias.
Detailed Market Structure Breakdown
4-Hour Chart (Macro Trend)
Structure: The Bank Nifty is still in a bullish uptrend, but the price has broken below the lower trendline of its steep short-term ascending channel. The last 4H candle is a strong bearish candle that confirms the Market Structure Shift (MSS) to the downside, signaling a likely deeper pullback.
Key Levels:
Major Supply (Resistance): 56,600 - 56,800. This area is the immediate overhead supply zone, aligning with the rejection high.
Major Demand (Support): 55,400 - 55,600. This area is the key FVG (Fair Value Gap) and the most significant horizontal support for the current uptrend.
Outlook: The trend has shifted to sideways-to-bearish. The market is expected to consolidate or correct towards the 55,400 - 55,600 zone.
1-Hour Chart (Intermediate View)
Structure: The 1H chart shows a clear breakdown from the steep ascending channel. The price is now trading within a newly formed descending channel, making lower highs and lower lows.
Key Levels:
Immediate Resistance: The upper trendline of the descending channel, near 56,300.
Immediate Support: 56,000 (The psychological level and the bottom of the current corrective channel).
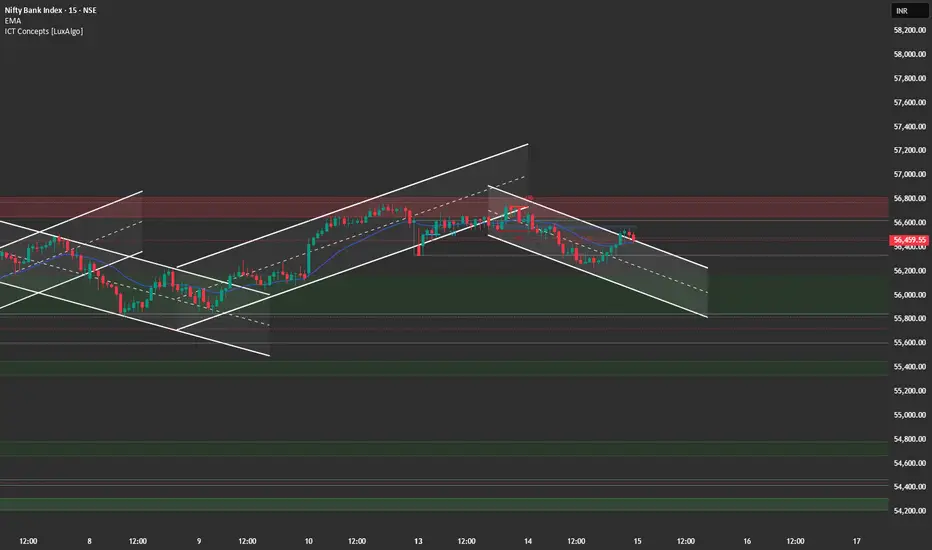
15-Minute Chart (Intraday View)
Structure: The 15M chart confirms the intraday bearish momentum. The price broke out of a small consolidation range to the downside and closed near its low, indicating strong bearish control.
Key Levels:
Intraday Supply: 56,300.
Intraday Demand: 56,000.
Outlook: Bearish. A "Sell on Rise" strategy is recommended near 56,300.
📈 Trade Plan (Wednesday, 15th October)
Market Outlook: The Bank Nifty is undergoing a sharp short-term correction. The primary strategy will be to sell into strength or on a breakdown of immediate support. Tech Mahindra and Persistent Systems Q2 results are due today, which may provide sector-specific volatility.
Bearish Scenario (Primary Plan)
Justification: The breakdown of the steep channel and the rejection from the highs favor a continuation of the correction.
Entry: Short entry on a successful retest and rejection of the 56,300 level (upper channel resistance). Alternatively, short a decisive break and 15-minute candle close below 56,000.
Stop Loss (SL): Place a stop loss above 56,600 (above the immediate swing high/supply zone).
Targets:
T1: 55,800 (Minor support/FVG).
T2: 55,400 (Major FVG support).
Bullish Scenario (Counter-Trend/Reversal Plan)
Justification: Only valid if Q2 results provide a strong positive surprise, leading to a break of the current channel.
Trigger: A sustained move and close above the major resistance at 56,600.
Entry: Long entry on a confirmed 15-minute close above 56,600.
Stop Loss (SL): Below 56,400.
Targets:
T1: 57,000 (Psychological target).
T2: 57,300 (Extension target).
Key Levels for Observation:
Immediate Decision Point: 56,000 - 56,300 zone.
Bearish Confirmation: A break and sustained move below 56,000.
Bullish Confirmation: A move back above 56,600.
Line in the Sand: 55,800. Below this level, the short-term bullish bias is severely challenged.
Detailed Market Structure Breakdown
4-Hour Chart (Macro Trend)
Structure: The Bank Nifty is still in a bullish uptrend, but the price has broken below the lower trendline of its steep short-term ascending channel. The last 4H candle is a strong bearish candle that confirms the Market Structure Shift (MSS) to the downside, signaling a likely deeper pullback.
Key Levels:
Major Supply (Resistance): 56,600 - 56,800. This area is the immediate overhead supply zone, aligning with the rejection high.
Major Demand (Support): 55,400 - 55,600. This area is the key FVG (Fair Value Gap) and the most significant horizontal support for the current uptrend.
Outlook: The trend has shifted to sideways-to-bearish. The market is expected to consolidate or correct towards the 55,400 - 55,600 zone.
1-Hour Chart (Intermediate View)
Structure: The 1H chart shows a clear breakdown from the steep ascending channel. The price is now trading within a newly formed descending channel, making lower highs and lower lows.
Key Levels:
Immediate Resistance: The upper trendline of the descending channel, near 56,300.
Immediate Support: 56,000 (The psychological level and the bottom of the current corrective channel).
15-Minute Chart (Intraday View)
Structure: The 15M chart confirms the intraday bearish momentum. The price broke out of a small consolidation range to the downside and closed near its low, indicating strong bearish control.
Key Levels:
Intraday Supply: 56,300.
Intraday Demand: 56,000.
Outlook: Bearish. A "Sell on Rise" strategy is recommended near 56,300.
📈 Trade Plan (Wednesday, 15th October)
Market Outlook: The Bank Nifty is undergoing a sharp short-term correction. The primary strategy will be to sell into strength or on a breakdown of immediate support. Tech Mahindra and Persistent Systems Q2 results are due today, which may provide sector-specific volatility.
Bearish Scenario (Primary Plan)
Justification: The breakdown of the steep channel and the rejection from the highs favor a continuation of the correction.
Entry: Short entry on a successful retest and rejection of the 56,300 level (upper channel resistance). Alternatively, short a decisive break and 15-minute candle close below 56,000.
Stop Loss (SL): Place a stop loss above 56,600 (above the immediate swing high/supply zone).
Targets:
T1: 55,800 (Minor support/FVG).
T2: 55,400 (Major FVG support).
Bullish Scenario (Counter-Trend/Reversal Plan)
Justification: Only valid if Q2 results provide a strong positive surprise, leading to a break of the current channel.
Trigger: A sustained move and close above the major resistance at 56,600.
Entry: Long entry on a confirmed 15-minute close above 56,600.
Stop Loss (SL): Below 56,400.
Targets:
T1: 57,000 (Psychological target).
T2: 57,300 (Extension target).
Key Levels for Observation:
Immediate Decision Point: 56,000 - 56,300 zone.
Bearish Confirmation: A break and sustained move below 56,000.
Bullish Confirmation: A move back above 56,600.
Line in the Sand: 55,800. Below this level, the short-term bullish bias is severely challenged.
คำจำกัดสิทธิ์ความรับผิดชอบ
ข้อมูลและบทความไม่ได้มีวัตถุประสงค์เพื่อก่อให้เกิดกิจกรรมทางการเงิน, การลงทุน, การซื้อขาย, ข้อเสนอแนะ หรือคำแนะนำประเภทอื่น ๆ ที่ให้หรือรับรองโดย TradingView อ่านเพิ่มเติมใน ข้อกำหนดการใช้งาน
คำจำกัดสิทธิ์ความรับผิดชอบ
ข้อมูลและบทความไม่ได้มีวัตถุประสงค์เพื่อก่อให้เกิดกิจกรรมทางการเงิน, การลงทุน, การซื้อขาย, ข้อเสนอแนะ หรือคำแนะนำประเภทอื่น ๆ ที่ให้หรือรับรองโดย TradingView อ่านเพิ่มเติมใน ข้อกำหนดการใช้งาน