Based on the charts and the market's performance on Monday, September 22, the Bank Nifty has experienced a significant corrective move. The index has broken below its rising channel, suggesting a shift in short-term momentum from bullish to bearish.
Detailed Market Structure Breakdown
4-Hour Chart (Macro Trend)
Structure: The long-term trend remains bullish, as the index is still well above its early September lows. However, the last two 4-hour candles show a sharp rejection from the highs and a break below the ascending channel. This is a clear signal of weakness and suggests a potential deeper correction is in the works.
Key Levels:
Major Supply (Resistance): 55,800 - 56,000. This level has proven to be a very strong supply zone, rejecting the price on multiple occasions. It is now a critical resistance to watch.
Major Demand (Support): The most crucial support for the bulls is the 55,050 - 55,200 zone. This area, which includes a prior breakout level, is the key "line in the sand" for the current bullish trend. A break below this would signal a significant trend reversal.
1-Hour Chart (Intermediate View)
Structure: The 1H chart shows a clear MSS (Market Structure Shift) to the downside. The price has broken below the lower trendline of the rising channel and its immediate support at 55,400. This confirms the short-term bearish bias. The index is now making lower highs and lower lows.
Key Levels:
Immediate Resistance: The 55,400 - 55,500 area, which was a strong support, has now become a crucial resistance zone.
Immediate Support: The next key support level is the 55,200 mark. This is a psychological level that was tested and is a likely target for the bears.
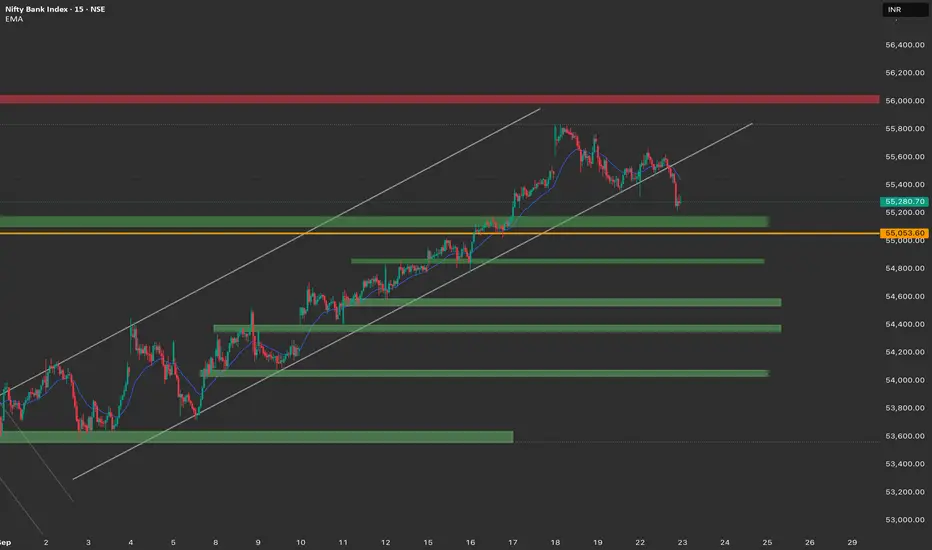
15-Minute Chart (Intraday View)
Structure: The 15M chart provides a clearer picture of the intraday fall. The price is showing a minor consolidation after the sharp decline. This is likely a pause before the next move.
Key Levels:
Intraday Supply: The 55,400 area, which is the high of the recent consolidation.
Intraday Demand: The low of the recent consolidation and the intraday low, near 55,200.
Outlook: The intraday bias is bearish. The market is likely to continue its downward movement unless it can reclaim the 55,400 resistance level.
Trade Plan (Monday, 23rd September)
Market Outlook: The market is now in a short-term bearish phase. A "sell on rise" strategy seems more favorable, but a strong reversal from a key support level is also a possibility.
Bearish Scenario (Primary Plan)
Justification: The market has shown a clear change in structure with a breakdown of key levels. The path of least resistance is to the downside.
Entry: Look for a short entry if the price retests the 55,400 - 55,500 level and shows signs of rejection with a bearish candlestick pattern. Alternatively, a breakdown and 15-minute close below 55,200 would trigger a short entry.
Stop Loss (SL): Place a stop loss above 55,600.
Targets:
T1: 55,050 - 55,000 (Next major support).
T2: 54,800 (Next major demand zone).
Bullish Scenario (Counter-Trend Plan)
Justification: This is a counter-trend plan and should be approached with caution. It is based on the possibility of a strong bounce from a key support level.
Trigger: A strong bullish reversal candle (e.g., a hammer or engulfing pattern) near the 55,050 - 55,200 demand zone.
Entry: Long entry on a confirmed bounce from the demand zone.
Stop Loss (SL): Below 55,000.
Targets:
T1: 55,400 (Intraday resistance).
T2: 55,600 (Recent swing high).
Key Levels for Observation:
Immediate Decision Point: The 55,200 - 55,400 zone.
Bearish Confirmation: A break and sustained move below 55,200.
Bullish Confirmation: A recapture of the 55,400 level.
Line in the Sand: The 55,050 - 55,200 zone. The overall bullish trend is in jeopardy if this level is decisively broken.
Detailed Market Structure Breakdown
4-Hour Chart (Macro Trend)
Structure: The long-term trend remains bullish, as the index is still well above its early September lows. However, the last two 4-hour candles show a sharp rejection from the highs and a break below the ascending channel. This is a clear signal of weakness and suggests a potential deeper correction is in the works.
Key Levels:
Major Supply (Resistance): 55,800 - 56,000. This level has proven to be a very strong supply zone, rejecting the price on multiple occasions. It is now a critical resistance to watch.
Major Demand (Support): The most crucial support for the bulls is the 55,050 - 55,200 zone. This area, which includes a prior breakout level, is the key "line in the sand" for the current bullish trend. A break below this would signal a significant trend reversal.
1-Hour Chart (Intermediate View)
Structure: The 1H chart shows a clear MSS (Market Structure Shift) to the downside. The price has broken below the lower trendline of the rising channel and its immediate support at 55,400. This confirms the short-term bearish bias. The index is now making lower highs and lower lows.
Key Levels:
Immediate Resistance: The 55,400 - 55,500 area, which was a strong support, has now become a crucial resistance zone.
Immediate Support: The next key support level is the 55,200 mark. This is a psychological level that was tested and is a likely target for the bears.
15-Minute Chart (Intraday View)
Structure: The 15M chart provides a clearer picture of the intraday fall. The price is showing a minor consolidation after the sharp decline. This is likely a pause before the next move.
Key Levels:
Intraday Supply: The 55,400 area, which is the high of the recent consolidation.
Intraday Demand: The low of the recent consolidation and the intraday low, near 55,200.
Outlook: The intraday bias is bearish. The market is likely to continue its downward movement unless it can reclaim the 55,400 resistance level.
Trade Plan (Monday, 23rd September)
Market Outlook: The market is now in a short-term bearish phase. A "sell on rise" strategy seems more favorable, but a strong reversal from a key support level is also a possibility.
Bearish Scenario (Primary Plan)
Justification: The market has shown a clear change in structure with a breakdown of key levels. The path of least resistance is to the downside.
Entry: Look for a short entry if the price retests the 55,400 - 55,500 level and shows signs of rejection with a bearish candlestick pattern. Alternatively, a breakdown and 15-minute close below 55,200 would trigger a short entry.
Stop Loss (SL): Place a stop loss above 55,600.
Targets:
T1: 55,050 - 55,000 (Next major support).
T2: 54,800 (Next major demand zone).
Bullish Scenario (Counter-Trend Plan)
Justification: This is a counter-trend plan and should be approached with caution. It is based on the possibility of a strong bounce from a key support level.
Trigger: A strong bullish reversal candle (e.g., a hammer or engulfing pattern) near the 55,050 - 55,200 demand zone.
Entry: Long entry on a confirmed bounce from the demand zone.
Stop Loss (SL): Below 55,000.
Targets:
T1: 55,400 (Intraday resistance).
T2: 55,600 (Recent swing high).
Key Levels for Observation:
Immediate Decision Point: The 55,200 - 55,400 zone.
Bearish Confirmation: A break and sustained move below 55,200.
Bullish Confirmation: A recapture of the 55,400 level.
Line in the Sand: The 55,050 - 55,200 zone. The overall bullish trend is in jeopardy if this level is decisively broken.
คำจำกัดสิทธิ์ความรับผิดชอบ
ข้อมูลและบทความไม่ได้มีวัตถุประสงค์เพื่อก่อให้เกิดกิจกรรมทางการเงิน, การลงทุน, การซื้อขาย, ข้อเสนอแนะ หรือคำแนะนำประเภทอื่น ๆ ที่ให้หรือรับรองโดย TradingView อ่านเพิ่มเติมใน ข้อกำหนดการใช้งาน
คำจำกัดสิทธิ์ความรับผิดชอบ
ข้อมูลและบทความไม่ได้มีวัตถุประสงค์เพื่อก่อให้เกิดกิจกรรมทางการเงิน, การลงทุน, การซื้อขาย, ข้อเสนอแนะ หรือคำแนะนำประเภทอื่น ๆ ที่ให้หรือรับรองโดย TradingView อ่านเพิ่มเติมใน ข้อกำหนดการใช้งาน